Sales Forecasting Methods: A Definitive Guide In 2024
Rapidly changing market conditions have made many of the traditional sales forecasting methods less effective. If you’re having trouble keeping up with market changes and accurately predicting the sales pipeline for your business, you’re likely not using the right sales forecasting method.
In this post, you’ll learn what sales forecasting is and how to use the latest models to predict sales with the highest accuracy for the next quarter.
Let’s get right into it.
What Is Sales Forecasting?
Sales forecasting means figuring out how much you expect to sell in the future based on what you sold before and analyzing the current market. It helps you predict how many products or services you will likely sell over a certain time so you can make smart decisions about managing what you have in stock, advertising, and planning for your business.
Sales forecasting also lets you spot trends and learn where demand might change or new chances in the market.
For example, looking at past sales, you might notice that people start buying more winter clothes like leather or tweed jackets in early October each year, showing a pattern that helps you plan ahead.
Why Is Sales Forecasting Important?
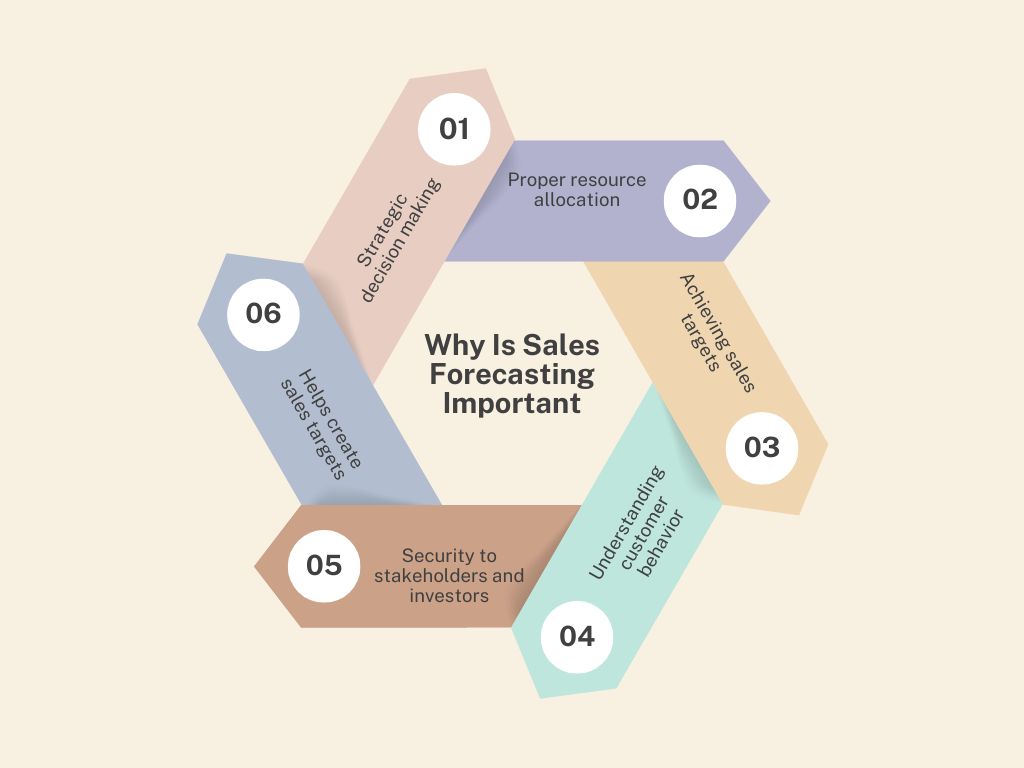
Using sales forecasts, your business can create yearly, quarterly, or monthly revenue benchmarks based on anticipated sales. These benchmarks will help you visualize sales cycles and predict your company’s growth in that sales length cycle.
Let’s say you own a SaaS company that offers real estate technology to relators and brokers. Using past sales data, you forecast that your sales for the upcoming year will be $600,000. You break this down into quarterly benchmarks:
- Q1 (Jan-March): $150,000
- Q2 (Apr-Jun): $120,000
- Q3 (Jul-Sep): $180,000
- Q4 (Oct-Dec): $150,000
Your goal for January is to generate $50,000 in revenue. If you can’t do so, your marketing team and sales managers will push sales reps for promotions in February to stay on track. This will help you manage and plan your company’s growth throughout the year.
It also helps you:
- Learn about future market trends to make informed decisions about product development, market expansion, and budgeting.
- Predict future sales volume so you can allocate resources like inventory, labor, and marketing spend better and avoid overspending. Implementing physical asset management software can streamline the tracking and management of your assets, leading to more accurate forecasting and optimized resource allocation.
- Set achievable targets for the sales teams and identify high-potential leads so they can prioritize their prospects and focus on the most promising clients.
- It identifies customer preferences and buying cycles to meet their needs better.
- When investors feel confident about your company’s financial health and future revenues, they are more likely to invest.
9 Types Of Sales Forecasting Methods You Must Know
As you review these sales forecasting models, consider how it fits with your available sales data and business needs.
1. Intuitive Analysis
It uses your experience and judgment to predict your company’s future performance without any complex statistical analysis. This is useful when:
- You lack sufficient historical data or market research.
- You have strong industry experience and insights that sales data alone can’t capture.
- You’re entering new or rapidly changing markets.
- You need to quickly identify emerging trends or shifts that your sales data hasn’t yet captured.
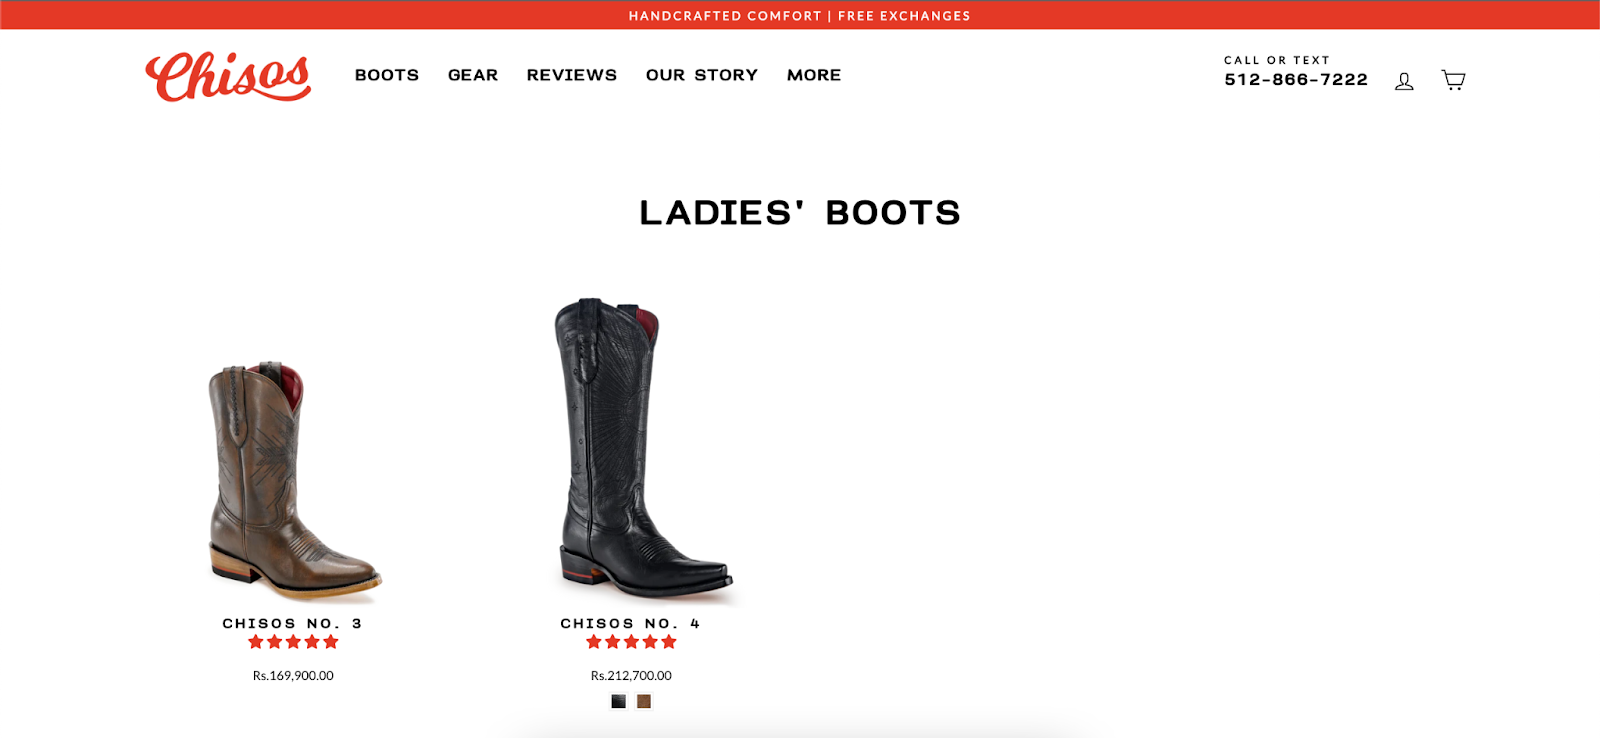
Here’s an excellent example to explain the point: Chisos is an established male boots manufacturer. While they already have strong industry expertise, they are entering a new market (ladies boots) where they have to answer questions like:
- Should we keep our current product variations?
- Is it a good time to bring more designs to the table?
2. Causal Analysis
This sales forecasting method is based on a cause-and-effect relationship between sales and some independent variables like advertising spend, changed product prices, seasonal variation, inflation, and changes in distributor channels. It heavily relies on accurate statistical data.
An excellent example is this healthcare brand Main Clinic Supply that sells portable oxygen concentrator backpacks and inogen accessories. The nature of their business is such that they get heavily impacted by seasonal variations, regulatory changes in healthcare, and healthcare policies and reforms.
They will use causal analysis to study the impact of external factors like government healthcare funding and seasonal flu trends on future sales.
For example, if past sales data shows that a 3% increase in healthcare funding typically gives a 1.5% rise in sales, they can use this model to predict sale outcomes under similar conditions.
3. Historical Analysis
This method uses past data to predict future performance by multiplying past sales by the average growth rate.
Let’s say you run a boutique coffee shop and want to forecast sales for August 2024. Last year, your sales for August were $15,000, the annual sales were $200,000 in 2023 and $150,000 in 2022.
Calculate the annual growth rate using the formula:
- [(most recent year’s sales – previous year’s sales) / previous year’s sales] / * 100%
This gives you a growth rate of:
- [(200,000 – 150,000) / 150,000] / * 100% = 33.33%
Using the historical sales forecasting method, you multiply last year’s August sales by 1.3333 (to account for the 33.33% growth rate), arriving at a sales forecast of $20,000 for this August.
You can calculate growth rates for the past 5 years using the same formula to get more accurate sales forecasts.
Then, take an average of those rates using the formula:
- Growth rate from: (Year 1+Year 2 + Year 3 + Year 4+ Year 5) / 5
Now, multiply the average rate with last year’s August sales forecast to obtain this year’s forecast for August.
This straightforward approach provides a quick estimate, but it may not account for new competitors opening nearby or an upcoming local event that could affect sales outcomes.
4. Trend Analysis
This analyzes historical sales data to predict future patterns and trends.
This method works best for companies dealing with a lot of seasonal variation and fluctuating demand patterns in sales.
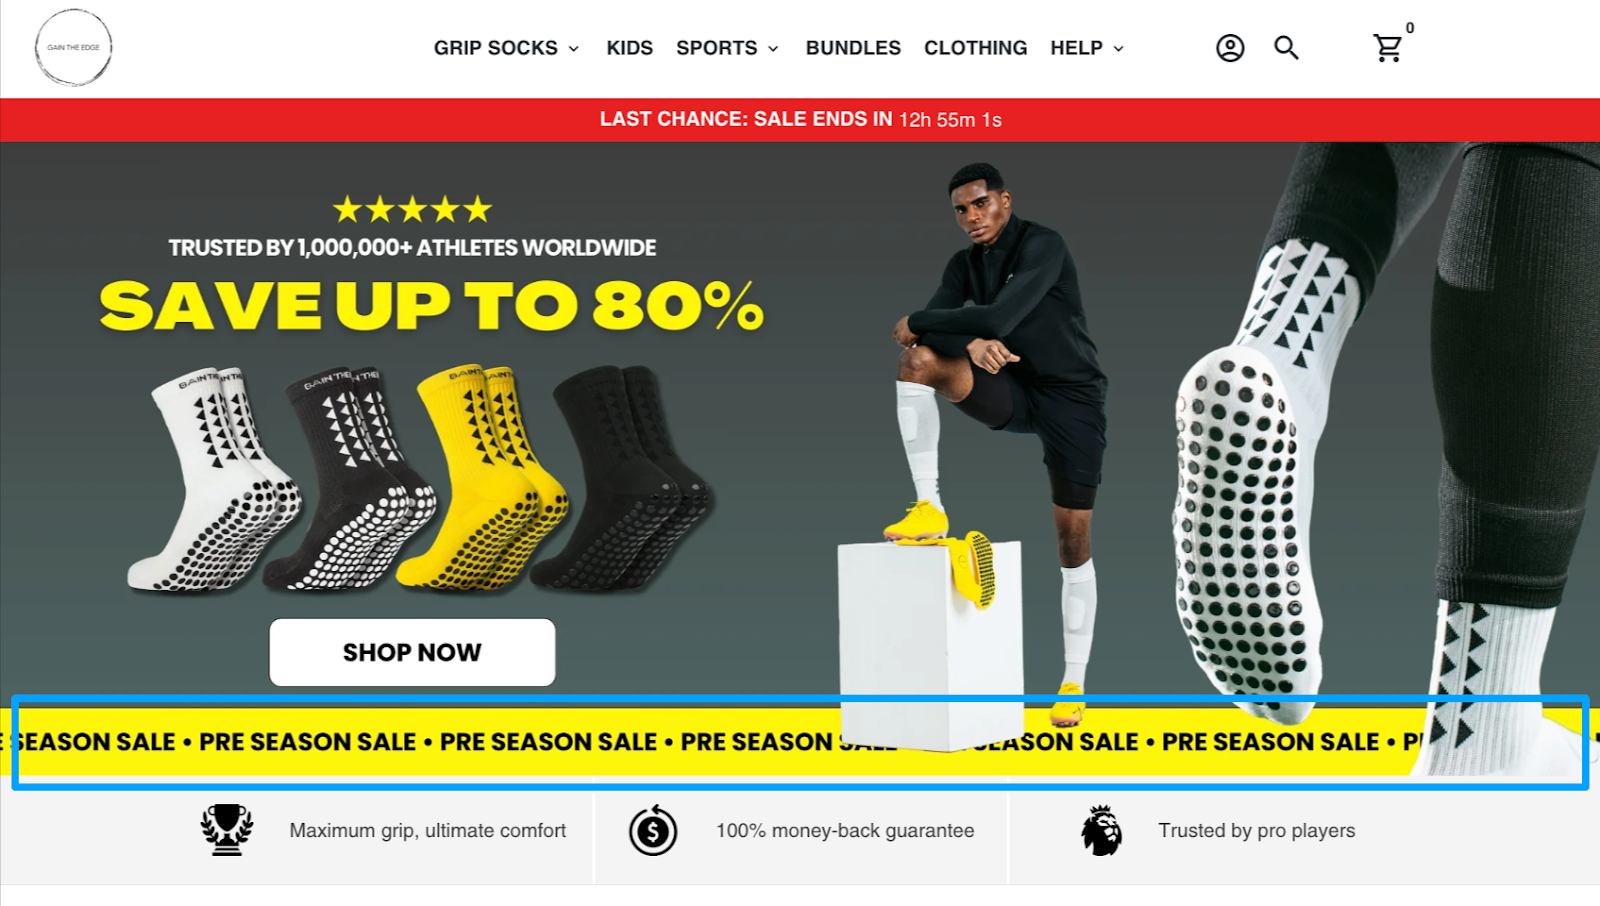
An excellent example to highlight here are sport-specific wearables like what this grip sock brand offers. Grip socks are popular only in certain seasons and the company capitalizes on that opportunity to offer pre-season sales.
But how could it have found this seasonal pattern? Let’s understand with this scenario:
The company wants to forecast sales trends for its grip socks over the next year. It will collect monthly sales data for the past few years and plot it on a graph, with sales on the y-axis and months on the x-axis. Let’s say it consistently recorded higher sales during the following seasons:
- Winter holidays (November and December) because of gift purchases and New Year fitness resolutions.
- Spring (March to May) because of the start of sports seasons.
- Summer (June to August) because of outdoor activities and fitness camps.
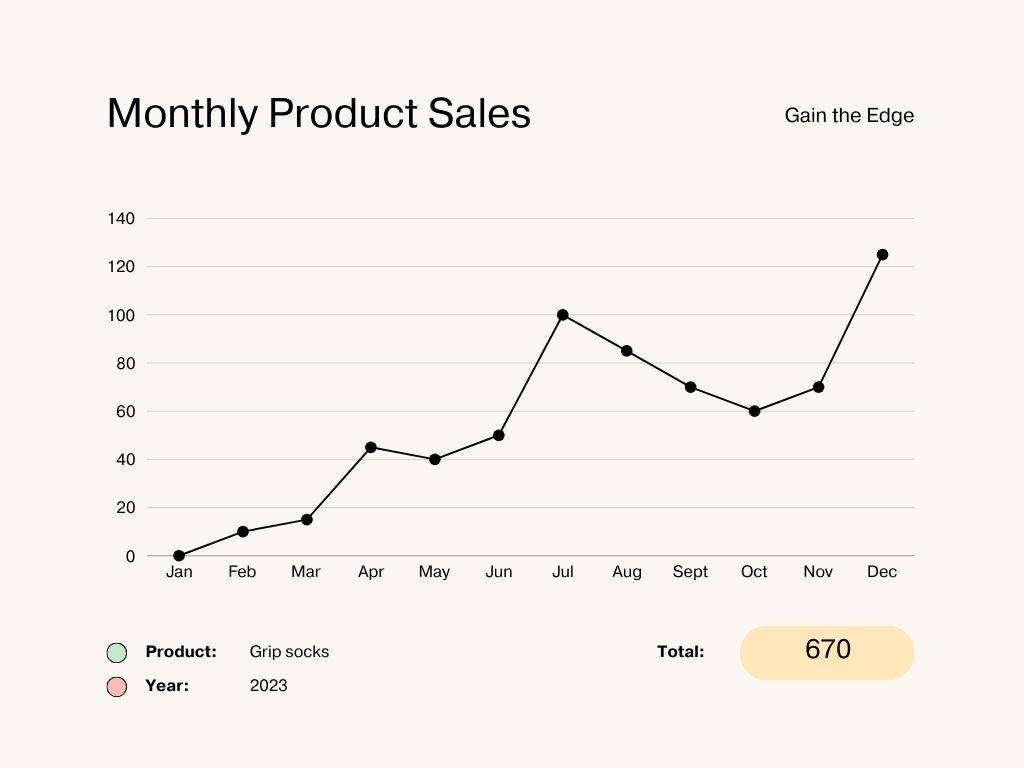
The graph visualizes these patterns and seasonal variations. An upward slope means sales are likely to increase, and consistent peaks during specific months mean higher demand during that period.
The company can then use this pattern to project future sales outcomes in the following ways:
- Calculate the average rate at which sales have grown or declined over previous periods. Calculate the percentage change in sales from one period to the next using the growth rate formula above and average these changes.
- Use simple linear regression analysis to fit a trend line to historical data. Extend the trendline into the future to estimate future sales values. Adjust the line based on observed seasonal peaks and troughs.
This will help them manage and stock inventory appropriately, hire new employees and sales reps, and create sales strategies to meet this demand, making sure they are well-prepared for high-sales periods.
5. Multivariable Analysis
It uses statistical software like Excel or Python and machine learning algorithms to analyze multiple variables to predict upcoming sales. It is the most accurate statistical sales forecasting method.
Many businesses partner with IT outsourcing companies to develop and implement the Multivariable Analysis. These companies provide expertise in data science, AI, and cloud-based solutions, allowing businesses to leverage sophisticated analytics without needing in-house technical teams.
This analysis will identify how multiple variables like advertising spend, product price per unit, and social media engagement are impacting sales.
Let’s say the statistical model shows:
- For every additional dollar spent on advertising, sales increase by $2.5.
- For every dollar increase in product price per unit, sales decrease by $1,000.
- For every additional social media interaction, sales increase by $3.
If the company plans to spend $16,000 on advertising, price each unit at $14, and expects 7,000 social media interactions in a given month, the predicted sales can be calculated as:
Predicted sales = 20,000 + 2.5 (Advertising Expenditure) − 1,000 (Price per Unit) + 3 (Social Media Engagement)
Predicted Sales = 20,000 + 2.5 (16,000)− 1,000 (14) + 3 (7,000)
So, the predicted sales for that month would be $67,000 based on the given factors.
Use this analysis type for fashion manufacturing and beauty brands, which are directly influenced by the unit price of their raw product.
Here’s a great example: Andar, specializing in high-quality leather goods, can analyze how factors like the cost of full-grain leather, labor expenses, and production volumes interact to affect their overall production costs.
With this, they can determine the best purchase times for full-grain leather when prices are lower and adjust their production schedules to minimize costs.
6. Lead Driven Forecasting
The model considers data such as customer interest and past purchase history. Based on past performance data, it analyzes the current number of potential customers you’re attracting and the chances they will purchase.
This makes it easier for your sales teams to distinguish between customers with a higher and lower potential to make a sale. Your marketing team and sales manager can then run tailored and personalized marketing campaigns to target people who are likely to make purchases.
- Collect leads from website sign-ups, email campaigns, and social media ads. Use CRM software to track all leads, their stages, and interactions. Let’s say you have 100 leads for the month.
- For each customer, note details like contact information and the potential value of the sale.
- Remove duplicates and correct inaccuracies in the data.
- Compare historical data to understand how many of these customers actually buy the product. Let’s say customers from your website make a purchase 30% of the time, while customers from social media sites only purchase 20% of the time.
- Find out the total number of leads converted into paying customers. Assuming you have 50 leads from the website and 50 from social media sites in the upcoming quarter, you will get 15 customers (0.3 * 50) from the website and 10 (0.2 * 50) from social media.
- Find out the average amount each of these customers spends. If a customer spends $200 on your website and $150 through your social media platform, the calculation to find forecasted sales would be:
- Total sales from the website: $200 * 15 = $3,000
- Total sales through social media: $150 * 10 = $1,500
- Sum the forecasted sales for each of these platforms to get the total forecasted sales:
- Total forecasted sales: $3000 + $1500 = $4.500
Small online businesses, which attract customers from multiple communication channels, can use the lead driven sales forecasting method to predict sales outcomes accurately. This vinyl stickers brand is an excellent example.
It offers a wide range of products, including custom die-cut stickers and the nature of its business demands using multiple communication channels, including Instagram, Facebook, Amazon, and its website, to reach diverse customer segments effectively.
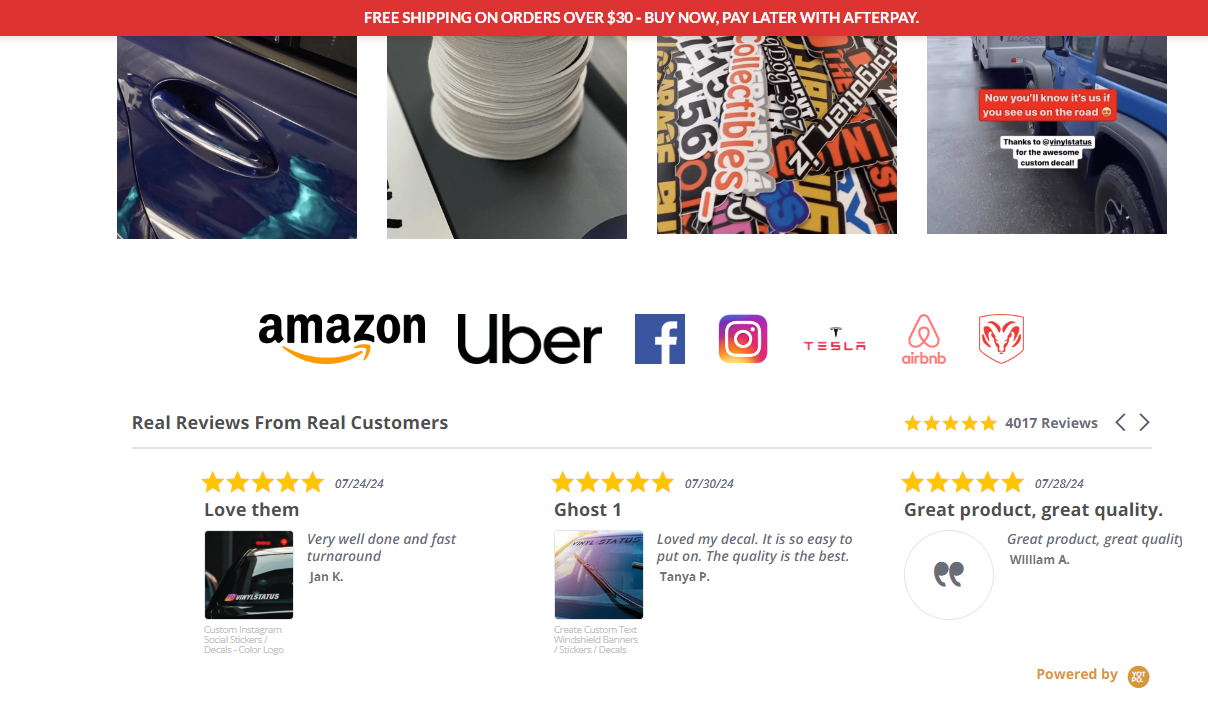
Using lead-driven sales forecasting, they can determine which channels are the most effective in generating sales. This helps them allocate funds more efficiently and invest in the most productive channels to improve marketing strategies and maximize returns.
7. Length Of Sales Cycle Forecasting
This model predicts how long it will take to close a sale, from the moment a potential customer shows interest until they purchase.
For example, an online store tracks the time it takes for customers to move through stages like showing initial interest, browsing the website, adding to cart, and finally, purchasing. These companies can also reduce cart abandonment with SMS, sending timely reminders and exclusive offers to encourage customers to complete their purchase.
If, on average, it takes 7 days from the moment a customer first inquires until they place an order, the store can use this information to estimate when they will close sales.
B2B companies, software providers, and manufacturers of high-value products use this method to estimate when their deals will close based on how long similar deals took in the past. This helps them plan better, allocate resources effectively, and set realistic sales goals.
8. Opportunity Stage Sales Forecasting
It is used to predict future sales by looking at where each potential deal (opportunity) is in the sales process. Different stages in the sales process have different probabilities of closing, which helps you estimate future sales revenue.
- Identify the stages in your sales process. Common stages include lead generation, qualification, proposal, negotiation, and closing.
- Based on historical data, assign a probability of closing for each stage (e.g., Lead Generation: 10%, Qualification: 25%)
- Collect data on all current deals in your sales pipeline, including the stage each deal is in and its potential value.
- For each deal, multiply the potential value by the probability of closing associated with its current stage.
Let’s assume you have the following opportunities in your sales pipeline:
- Opportunity A: In the “Initial Contact” stage, with a 10% probability and potential value of $50,000.
- Opportunity B: In the “Needs Analysis” stage, with a 30% probability and a potential value of $40,000.
- Opportunity C: In the “Proposal Sent” stage, with a 60% probability and a potential value of $30,000.
- Opportunity D: In the “Negotiation” stage, with an 80% probability and a potential value of $20,000.
Forecast calculations:
- Opportunity A: $50,000 * 10% = $5,000
- Opportunity B: $40,000 * 30% = $12,000
- Opportunity C: $30,000 * 60% = $18,000
- Opportunity D: $20,000 * 80% = $16,000
Total Forecasted Sales
$5,000 (Opportunity A) + $12,000 (Opportunity B) + $18,000 (Opportunity C) + $16,000 (Opportunity D) = $51,000
Based on the forecasted revenue, you can invest more in marketing campaigns and sales efforts to increase the chances of closing deals, set realistic sales targets, and stock inventory to meet the expected demand.
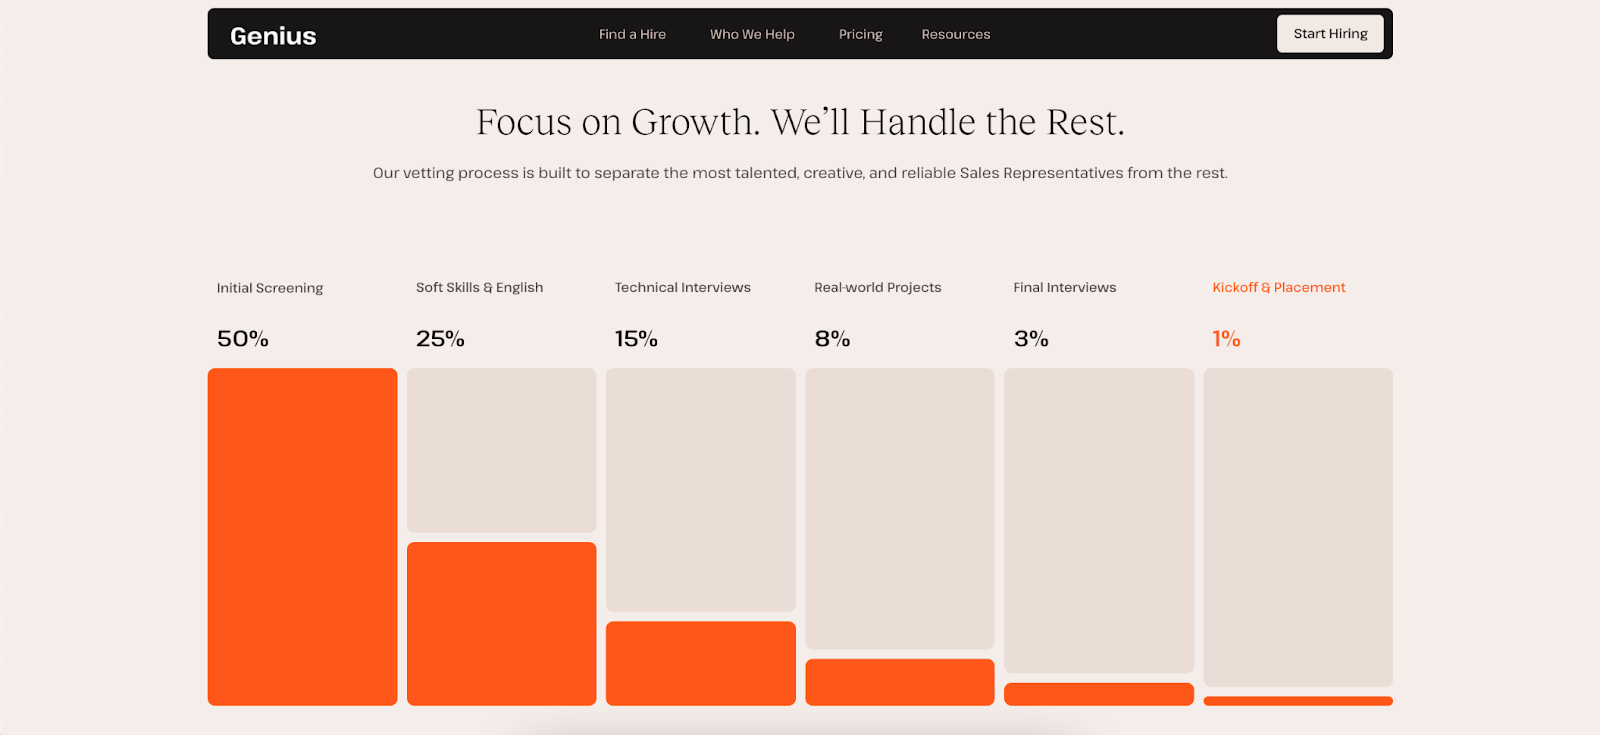
Real estate agencies, consulting firms, and talent-hunting companies like Genius are most likely to use opportunity stage sales forecasting so they can identify which aspect of their offer’s process yields the best results.
9. Test Market Analysis Method
It involves introducing a product to a small group of people to determine its future revenue potential.
This approach works especially well when developing a no code MVP, as it allows for quick validation and iteration without heavy upfront investment.
Let’s say you’re planning to introduce a new product line. Before a nationwide launch, introduce the product in selected regions first.
Distribute samples of the new product and track sales performance, customer demand patterns, customer feedback, and market response over a six-month trial period. This analysis gives insights into consumer preferences and the product’s viability.
This is especially common with pharmaceutical companies and health supplement retailers, but makeup brands and food and beverage companies, such as those selling draft systems like BLADE kegs, also use this sales forecasting technique.
An excellent example is this health supplement store. To implement a test market analysis, Vitamart can introduce new products or promotional campaigns in select, smaller markets before rolling them out nationwide.
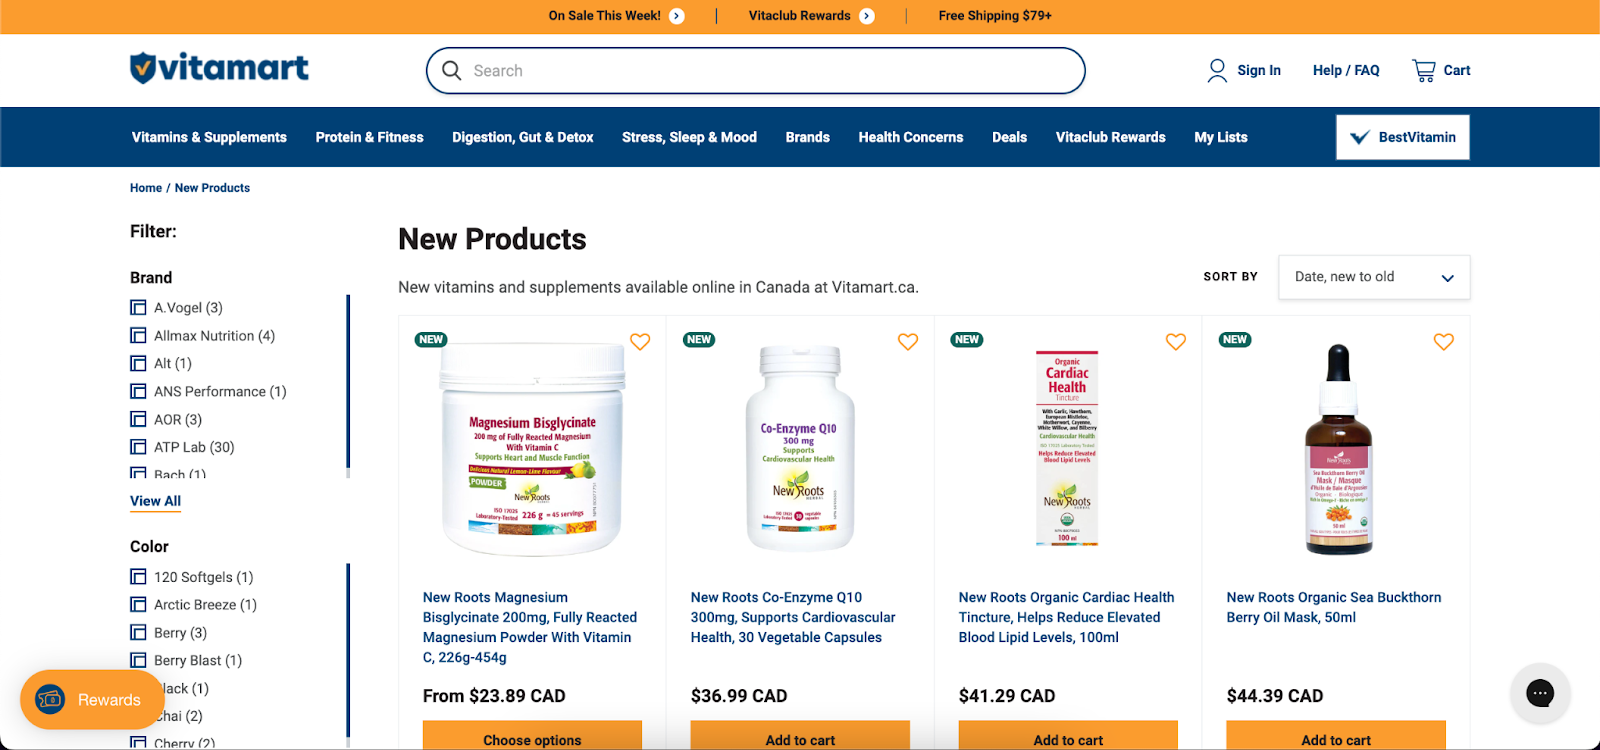
For example, they recently launched a new line of health products targeting specific health concerns like stress or immune support in Canada. They might analyze sales data, customer feedback, and engagement metrics from this test market and decide to launch these products in nearby countries as well.
This data helps them assess the potential success of the product on a larger scale and refine their marketing strategies based on real-world performance.
3 Factors To Consider When Choosing a Forecasting Method
Consider whether the forecasting models above capture all the nuances of your business environment before choosing them. Additionally, think about the following points:
I. Highlight Your Sales Goal
If your goal is to increase sales revenue by next year, consider trend analysis or multivariable analysis forecasting models, which can predict future sales revenue and company growth based on historical data and market trends.
If your goal is to convert potential customers into sales, choose opportunity-based sales forecasting that allows you to track and predict conversion rates accurately.
If your goal is to expand into a new market segment, prioritize test market analysis method or a lead driven forecasting model.
II. Assess Availability & Quality of Data
Almost all accurate sales forecasting methods require consistent and reliable data points over a specific period to identify trends and patterns accurately. If your historical data is inconsistent, use other sales forecasting methods, like intuitive sales forecasting.
III. Resource Availability
Assess whether your business has the funds, time, and expertise to implement your chosen sales forecasting method. A complex sales forecasting process or model generally incurs higher costs because it requires advanced analytical tools or consulting services. Using procurement management software can help reduce these costs by improving the efficiency of purchasing decisions, allowing your business to allocate resources more effectively.
Multivariable analysis sales forecasting also requires statistical knowledge and analytical skills you will need to build a high-performance sales team.
If your sales team lacks expertise in these areas, going for an intuitive sales forecasting method or relying on trend analysis that uses subjective insights and experience may be more feasible.
Conclusion
When you forecast sales for the next quarter, use a combination of quantitative and qualitative sales forecasting methods to improve accuracy and account for various market dynamics.
Except for intuitive analysis, all other models discussed in this post require accurate historical data. Collecting and analyzing this data requires time and effort, and you’ll also need an expert sales team to use the numbers to forecast accurately. We at Martal Group can help you generate leads and make sales more predictable. Contact us today.
Author Bio:
Burkhard Berger is the founder of Novum™. He helps innovative B2B companies implement modern SEO strategies to scale their organic traffic to 1,000,000+ visitors per month. Curious about what your true traffic potential is?