The SDR KPIs That Separate Top Teams From Busy Ones
Major Takeaways: SDR KPIs
SDR KPIs are the metrics that measure how effectively a sales development team turns outreach into qualified pipeline — across revenue, pipeline conversion, and outbound/inbound activity. The point is to connect daily SDR activity to revenue, not just count effort.
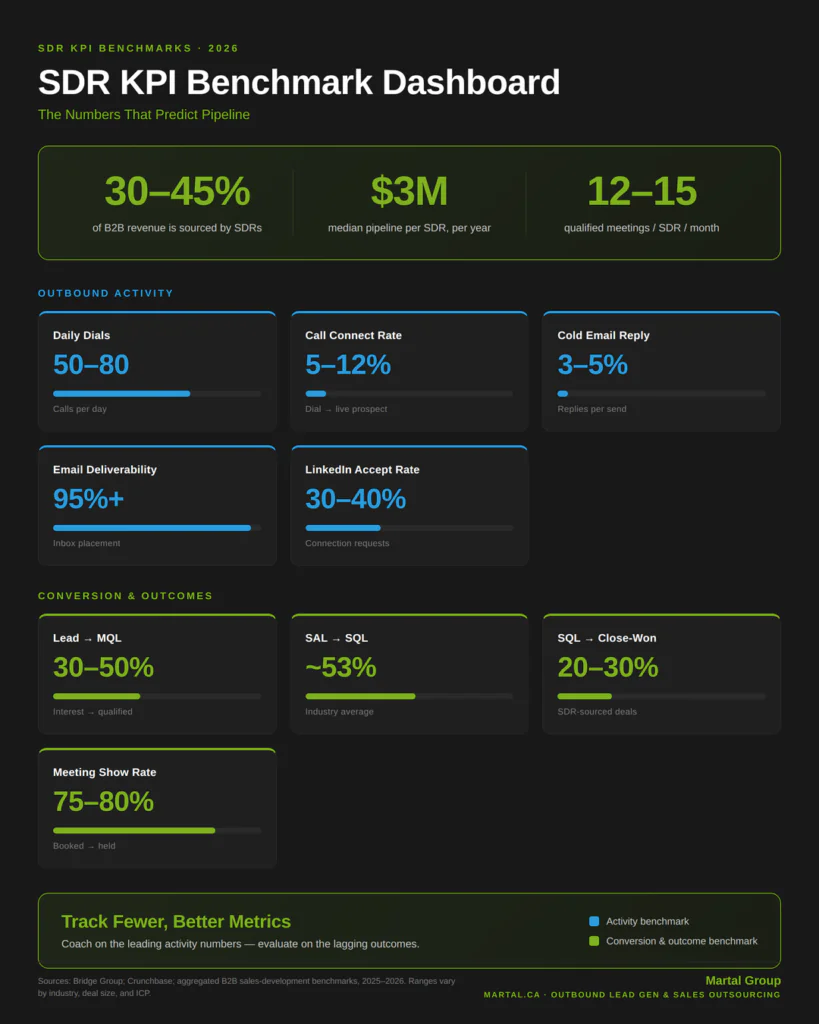
SDRs are responsible for as much as 30 to 45 percent of the new revenue in B2B, and $3 million a year is the average pipeline produced by one single SDR in the SaaS industry — so the SDR metrics you track directly shape company growth. (1)
Qualified meetings held, stage-to-stage conversion, and pipeline created are the lagging metrics that predict revenue. Dials and emails are leading indicators — useful for coaching, but not measures of success on their own.
Current benchmarks: 12-15 qualified meetings per month for an outbound SDR, a 75-80% meeting show rate, cold email reply rates around 3–5%, and call connect rates of roughly 5–12%. (5), (6)
Rewarding activity volume over outcomes. A hundred dials a day means nothing if none convert — track fewer, better SDR KPIs and coach to conversion, not raw count.
High activity but few meetings points to a conversion issue (data, targeting, messaging). Plenty of meetings but little pipeline points to weak qualification.
A dedicated outsourced team adds capacity plus researched, qualified prospect data. In one three-month pilot for Complete EDI, a single fractional rep delivered 14 SQLs — with clean, week-by-week visibility into every metric.
Introduction
Most SDR dashboards measure the wrong things. They count dials, emails, and “touches” — activity that feels productive but says almost nothing about whether pipeline is actually growing. The teams that win track a tighter set of SDR KPIs that tie daily effort to qualified meetings and revenue.
That distinction matters because of how much rides on the role. SDRs are responsible for as much as 30 to 45 percent of the new revenue in B2B, and $3 million a year is the average pipeline produced by one single SDR in the SaaS industry. Get the SDR metrics right and you have a predictable growth engine. Get them wrong and you’re paying for motion that never reaches an account executive. (1)
We’ve spent 16+ years running outbound lead generation, appointment setting, and SDR programs for B2B companies, so this guide is built from two sources: the metrics we manage to every day, and a review of the current public benchmarks buyers ask about most. The goal is simple — help you decide which KPIs to track, what “good” looks like, and how to improve the numbers that genuinely move pipeline.
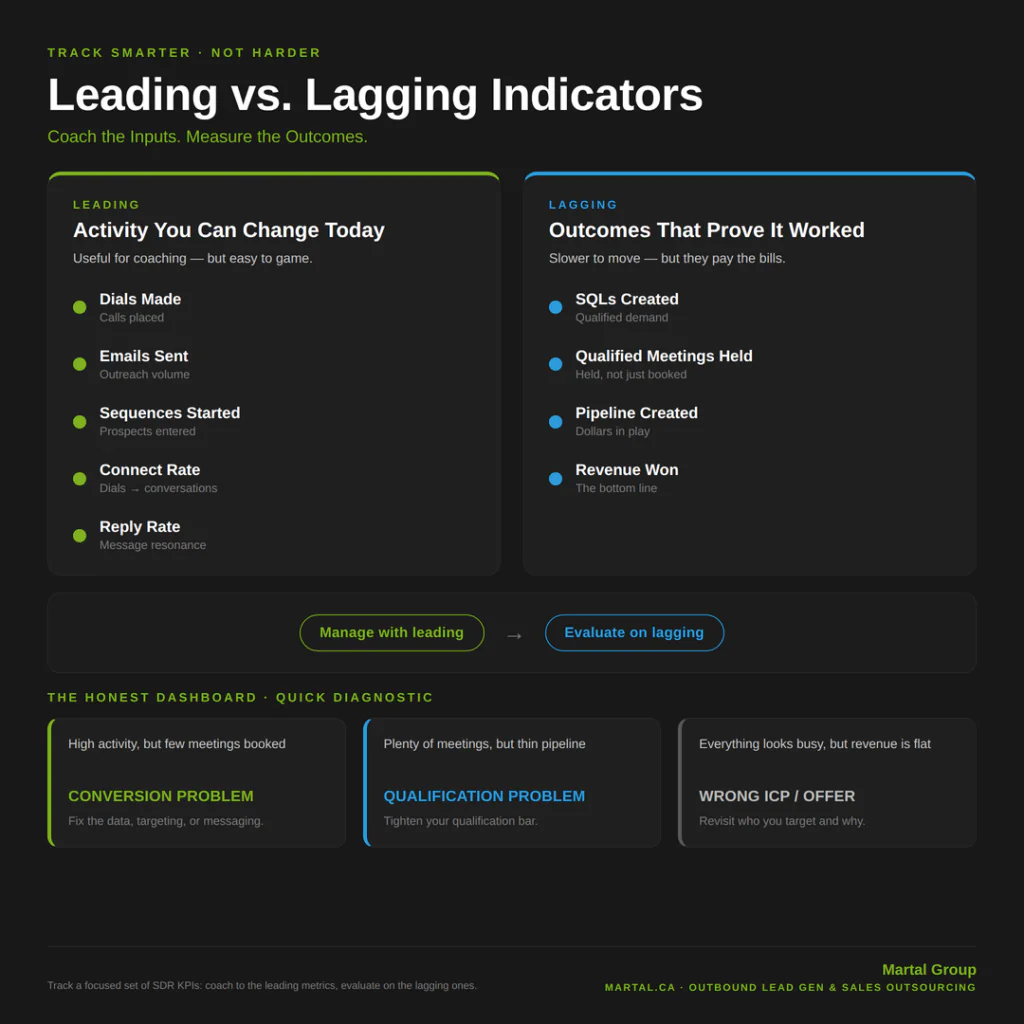
One idea to carry through the whole article: separate leading indicators (the activity you can change today — dials, emails, sequences sent) from lagging indicators (the outcomes that prove it worked — SQLs, booked meetings, revenue). You manage reps through the leading metrics and evaluate them on the lagging ones. Miss that distinction and you end up with a dashboard full of green activity numbers sitting on top of a red pipeline.
Here are the SDR KPIs that matter, grouped by what they measure.
SDR KPIs at a Glance: The Complete List
Here is a compiled list of SDR KPIs and their benchmarks. Treat these as orientation bands — adjust for your ACV, industry, and sales cycle.
Revenue KPIs
- Time to Revenue — No universal number; closed revenue lags your full sales cycle, so judge a ramping SDR on a quarter-plus horizon as they build toward ~$1–2M in sourced pipeline a year (2).
- Average Deal Size — Anchor it to your own ACV; outbound-sourced deals tend to run larger than inbound (~50% in some studies) (3).
- Return on Investment (ROI) — Measure pipeline and revenue against fully-loaded cost; the median SDR generates roughly $3M in pipeline a year, so a few closed deals clear the bill (1).
- Revenue Attainment — Target 100% of quota, but set numbers a ramped rep can realistically hit; honest quotas beat inflated ones (1).
- Cost per Lead (CPL) — Swings widely by channel (LinkedIn runs ~28% below Google Ads), so weigh it against lead quality, not in isolation (7).
Sales Pipeline Metrics
- Lead → MQL Conversion Rate — Roughly 20–40% of leads become MQLs once scoring and enrichment are tuned (8).
- MQL → SAL Conversion Rate — The sales-accept step; a healthy hand-off stays high, and a low rate is the first sign your MQL definition is too loose (8).
- SAL → SQL Conversion Rate — About 53% of sales-accepted leads become genuinely sales-qualified on average (3).
- SQL → Close-Won Conversion Rate — Around 22–30% of qualified opportunities close (9).
- Close-Lost Rate — The mirror of win rate; track why deals die (no-decision, timing, budget), not just that they did (9).
Outbound Activity Metrics
- Email Deliverability Rate — Aim for 95%+ inbox placement; SPF/DKIM/DMARC and a sub-0.1% complaint rate are now table stakes (10).
- Email Open Rate — ~21–39%, but Apple Mail Privacy Protection inflates it, so treat opens as directional rather than a target (4).
- Email Response Rate — Cold reply rates have slid to ~3–5% in 2026; above ~5% is solid and 8%+ is strong (11).
- LinkedIn Connection Acceptance Rate — 30–40% is healthy; below 20% points to targeting or profile problems before you scale volume (12).
- Average Daily Dials — Most SDRs make ~40–80 dials a day; volume only counts paired with verified data and good timing (13).
- Call Connection Rate — Cold connect rates run ~5–12% (far higher on verified mobile direct dials), and roughly 2.3% of dials convert to a meeting on average (13).
- Prospect → Lead Ratio — Only a slice of prospects become engaged leads; reps average ~4–6 quality conversations a day, so size your top-of-funnel accordingly (13).
- Booked Meeting Ratio — A ramped SDR books ~12–20 qualified meetings a month, with ~2–5% of prospects converting to a meeting (2).
- Meeting Show Rate — Aim for 75–80% of booked meetings to actually happen; same-day confirmations and reminder sequences are the biggest lever (2).
Inbound Activity Metrics
- Lead Response Time — Respond within 5 minutes; qualification odds drop sharply after that, yet the average B2B response is ~47 hours (14).
- Lead Qualification Rate — Expect ~20–40% of inbound leads to qualify; tighter ICP criteria trade volume for quality (4).
- Inbound Conversion Rate — Conversion swings enormously by intent and source — high-intent inbound (demo requests) converts many times better than low-intent content downloads (4).
Why SDR KPIs Matter
Three reasons a tight KPI framework earns its place — beyond “because you should measure things”:
Evaluating In-House Team Efficiency
Tracking the right SDR metrics tells you whether your team is spending time on the activities that actually open opportunities — or just staying busy. The trap is rewarding volume: 100 dials a day means nothing if none of them book a meeting. A good framework keeps reps focused on the leading activities that predict pipeline, then holds them to the lagging outcomes that prove it worked. That’s the difference between coaching “make more calls” and coaching “create more conversations.”
Enhancing Sales Forecasting
Accurate forecasts start with clean inputs. Manual collection across multiple sites is slow and error-prone; a web scraping API automates the pull and standardizes fields so your KPIs reflect reality, not messy data. From there, SDR KPIs sharpen forecasting by exposing the conversion rates between each pipeline stage — letting you predict future revenue from current activity instead of guessing. One caution from the pipeline side: a forecast is only as honest as the qualification behind it. If reps book loosely qualified meetings to hit an activity number, the forecast inherits that optimism. Tie forecasting to qualified, stage-defined conversion — not raw meeting counts.
Measuring Outsourced SDR Success
Measuring SDR KPIs is also essential when assessing the effectiveness of your outsourced SDRs’ efforts. By monitoring these metrics, you can evaluate whether your outsourced sales team is actually moving your pipeline and delivering ROI — not just sending activity reports. The advantage of a well-run engagement is that the numbers are visible from week one: emails sent, calls made, MQLs, SQLs, and meetings booked, tracked week over week.
One thing we see often: clients underestimate how fast a focused outbound engagement should produce measurable SQLs. In a three-month pilot for Complete EDI, a single fractional rep delivered 2 SQLs by the second week and 14 SQLs by the end of the pilot — exactly the kind of clean, stage-by-stage visibility a KPI framework is supposed to give you.
Want to know the ROI of outsourcing your sales to Martal? Use our ROI calculator for a personalized estimate in less than 30 seconds.
Standard KPIs for SDRs
We’ve grouped the SDR KPIs that matter into four buckets — revenue, pipeline, outbound activity, and inbound activity. Start with the outcomes your model cares about most, then work back to the activities that drive them.
Revenue KPIs
Revenue KPIs keep the focus on the quality and profitability of what SDRs create, not just the count. One fair caveat before the list: most of these are shared metrics. An SDR opens and qualifies the opportunity, but an account executive closes it — so read them as measures of SDR influence on revenue, not sole ownership.
A question sales leaders ask on forums is — “How much outbound revenue should a SDR/BDR be generating?” — usually lands right here. A useful rule of thumb: a strong outbound SDR setting 15–20 qualified meetings per month can support roughly $1–2 million in closed business over the year, depending on deal size. Use the KPIs below to pressure-test that math against your own funnel. (2)
Time to Revenue
What it is: The time from an SDR’s first contact with a lead to a closed deal — a read on overall sales velocity.
Why it’s tracked: It shows how quickly qualified conversations turn into revenue, which directly affects forecasting and cash flow.
How to calculate: Time to Revenue = Date of Deal Close − Date of Initial Contact
Benchmark: Highly dependent on deal size and complexity. Transactional SMB deals may close in 30–60 days; mid-market and enterprise cycles routinely run 3–9 months or longer. Establish your own baseline before borrowing anyone else’s number.
How to improve:
- Remove friction in the SDR-to-AE handoff — slow handoffs are where velocity quietly dies.
- Tighten qualification so AEs spend time on deals that can actually close.
- Use coordinated, omnichannel follow-up to keep momentum between touchpoints.
Average Deal Size
What it is: The typical revenue from deals closed off SDR-sourced leads.
Why it’s tracked: It reveals whether SDRs are surfacing the right kind of opportunity, not just volume.
How to calculate: Average Deal Size = Total Revenue from SDR-Sourced Deals ÷ Number of SDR-Sourced Deals
Benchmark: No universal figure — anchor it to your own ACV and revenue goals.
How to improve:
- Point SDR effort at higher-value accounts and senior decision-makers — precise targeting is where deal size grows.
- Sharpen qualification so smaller, poor-fit deals don’t crowd the pipeline.
- Surface expansion or multi-product fit early in qualifying conversations.
Return on Investment (ROI)
What it is: Revenue from SDR-led initiatives versus the cost of running the SDR function.
Why it’s tracked: It’s the metric that earns the SDR team a seat at the revenue table — and protects the budget when cuts come.
How to calculate: ROI = (Revenue from SDR-Led Initiatives − SDR Team Cost) ÷ SDR Team Cost × 100
Benchmark: A healthy SDR ROI is typically 5:1 or higher, varying with sales cycle and deal size.
How to improve:
- Improve fit before volume — better-targeted prospects lift revenue without lifting cost.
- Reduce ramp drag; faster, more consistent productivity moves ROI more than extra headcount.
- For lean teams, a fractional or outsourced model can deliver SQLs without the fixed overhead of building in-house.
Revenue Attainment
What it is: Revenue generated against an SDR’s (or the team’s) target.
Why it’s tracked: It ties SDR output directly to company revenue goals.
How to calculate: Revenue Attainment = (Revenue Generated by SDR ÷ Revenue Target) × 100
Benchmark: Aim for 100%+ — but set the target honestly. If fewer than half your reps clear quota, the target is usually the problem, not the team.
How to improve:
- Set targets by working backward from revenue, not from last quarter’s top performer.
- Review performance weekly so you can course-correct mid-quarter, not after it.
- Give reps the data, messaging, and coaching to hit goals — don’t just raise the number.
Cost per Lead (CPL)
What it is: The average cost to generate a single lead, including sales and marketing spend.
Why it’s tracked: It connects lead-generation efficiency to revenue potential.
How to calculate: CPL = Total Sales & Marketing Expenses ÷ Total Number of Leads
Benchmark: Varies widely by channel and industry — B2B CPL commonly runs from around $50 to several hundred dollars per lead, with complex enterprise verticals higher. Judge it against lead quality, never in isolation.
How to improve:
- Concentrate spend on the channels producing the highest-quality leads, not the cheapest.
- Sharpen audience segmentation so outreach reaches best-fit prospects.
- Use intent and buying signals to prioritize the accounts most likely to convert.
Is Cost Per Lead the best way to measure the effectiveness of outbound lead generation efforts? Check out this CPL guide to find out.
Sales Pipeline Metrics
Pipeline metrics track how efficiently prospects move from first touch toward a closed deal — and, more usefully, where they stall. “What’s a good conversion rate for an SDR?” is one of the most-searched questions in this category, and the honest answer is that the rate matters less than knowing which single stage is capping your pipeline. These are the metrics that show you.
How Martal frames the funnel:
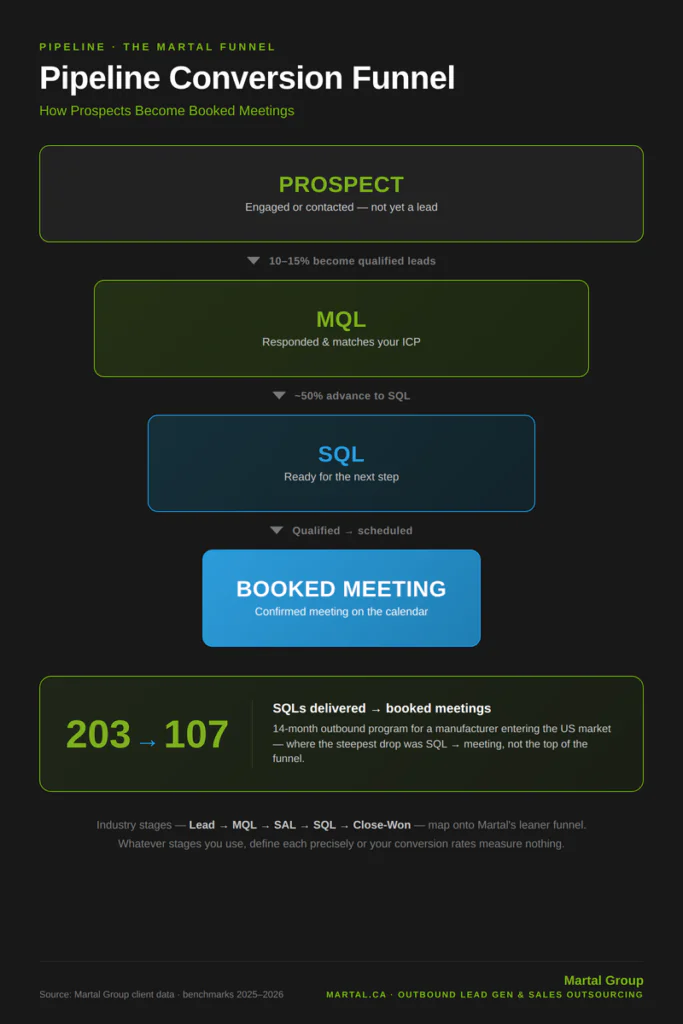
The stages below (Lead → MQL → SAL → SQL → Close-Won) are the broad industry standard, and we’ve used them here for clarity. Internally, we run a leaner pipeline — Prospect → MQL → SQL → Booked Meeting.
A prospect is simply someone we’ve engaged, never counted as a lead. An MQL is a prospect who has responded and matches the client’s ICP. An SQL is one who’s ready for the next step — more information or a meeting. And we qualify on authority and need, not on rigid budget-and-timeline checklists. The point isn’t that one model is “right” — it’s that whatever stages you use, you define them precisely and apply them consistently, or your conversion rates measure nothing.
Lead to MQL Conversion Rate
What it is: The share of leads that become Marketing Qualified Leads (MQLs) — prospects who’ve shown real interest, e.g., by responding or engaging.
Why it’s tracked: It gauges how well early targeting and nurturing turn raw interest into genuine fit.
How to calculate: Lead to MQL Conversion Rate = (Number of MQLs ÷ Total Number of Leads) × 100
Benchmark: Typically 30–50%, though it swings with lead source and ICP precision.
How to improve:
- Lead with relevant, useful content that earns a response.
- Personalize early outreach instead of blasting a generic message.
- Follow up promptly and consistently — timing drives engagement.
MQL to SAL Conversion Rate
What it is: The share of MQLs that sales accepts as worth pursuing (Sales Accepted Leads).
Why it’s tracked: It’s the cleanest test of marketing-to-sales alignment — and of whether your MQL definition is honest.
How to calculate: MQL to SAL Conversion Rate = (Number of SALs ÷ Total Number of MQLs) × 100
Benchmark: A healthy rate sits around 70–80%; lower usually means marketing and sales disagree on what “qualified” means.
How to improve:
- Agree on shared, written qualification criteria across marketing and sales.
- Keep a tight feedback loop so rejected MQLs sharpen the definition.
- Streamline the handoff so accepted leads don’t go cold in transit.
SAL to SQL Conversion Rate
What it is: The share of Sales Accepted Leads that become Sales Qualified Leads — vetted and ready for direct sales engagement.
Why it’s tracked: It measures the quality of your qualification, which is the heart of SDR work.
How to calculate: SAL to SQL Conversion Rate = (Number of SQLs ÷ Total Number of SALs) × 100
Benchmark: Industry data puts the average from Sales Accepted Lead (SAL) to SQL at 52.7%, so a rate in the 50–60% range is solid. (This is lower than older 60–70% figures — qualification has gotten harder as buyers screen more outreach.)
How to improve (3):
- Build a feedback loop between SDRs and AEs to keep refining what “qualified” means.
- Study your won deals to spot the patterns that predict a real SQL.
- Multithread into accounts — engaging several stakeholders raises qualification confidence.
SQL to Close-Won Conversion Rate
What it is: The share of SQLs that become paying customers.
Why it’s tracked: It’s the ultimate test of whether qualified pipeline actually converts.
How to calculate: SQL to Close-Won Conversion Rate = (Number of Close-Won Deals ÷ Total Number of SQLs) × 100
Benchmark: Often lands around 20–30% for SDR-sourced opportunities, depending on deal size and sales cycle.
How to improve:
- Use case studies and testimonials to build trust in the final stretch.
- Tailor proposals tightly to the prospect’s stated needs.
- Run immediate follow-ups after product presentations or demos to address concerns and keep momentum.
Close-Lost Rate
What it is: The share of SQLs that don’t convert — and, more importantly, the reasons why.
Why it’s tracked: Lost-deal patterns are one of the richest sources of intelligence on where your process breaks.
How to calculate: Close-Lost Rate = (Number of Close-Lost Deals ÷ Total Number of SQLs) × 100
Benchmark: Treat this as a diagnostic, not a target. By definition it’s the mirror image of your win rate — if 20–30% of SQLs close, the rest are “lost” for now. What matters is why, and how many are genuinely dead versus simply dormant.
How to improve:
- Review lost deals regularly and tag the real reason — price, timing, fit, or competitor.
- Feed those patterns back into targeting and messaging.
- Build a structured re-engagement track for “lost — timing” deals instead of writing them off.
A pattern we see across markets: conversion rates only mean something at volume, and they swing hard by industry. In a 14-month outbound program for a manufacturing company entering the US electrical and safety market for the first time, we delivered 203 SQLs and 107 booked meetings. View the manufacturing case study. The instructive part wasn’t the top of the funnel — it was the SQL-to-meeting step, which is exactly where most dashboards stop looking.
SDR Outbound Activity Merics
This is the engine room — and the area we work in every day. Outbound activity metrics measure the volume and quality of cold outreach across email, phone, and LinkedIn. The recurring question on forums like r/sales — “SDR/BDR — what are your daily metrics?” — almost always centers on this list. Two cautions from running these campaigns at scale: first, activity metrics are leading indicators — useful for coaching, easy to game; second, none of these channels works in isolation.
The teams that win run them as one coordinated, omnichannel sequence — email, calling, and LinkedIn reinforcing each other — not three disconnected efforts. Multi-channel outreach combining email, LinkedIn, and phone boosts results by over 287% compared to single-channel. (3)
Email Deliverability Rate
What it is: The percentage of emails that land in the inbox rather than spam.
Why it’s tracked: Everything downstream — opens, replies, meetings — depends on messages arriving, and it’s the clearest read on sender-reputation health.
How to calculate: Email Deliverability Rate = (Number of Delivered Emails ÷ Total Number of Emails Sent) × 100
Benchmark: Aim for 95%+. If your bounce rate is above 4%, stop tweaking subject lines and fix your contact data first.
How to improve: (4)
- Clean lists regularly to remove invalid or stale addresses.
- Warm up domains and rotate sending to protect reputation.
- Monitor sender score and authentication (SPF, DKIM, DMARC).
Email Open Rate
What it is: The percentage of recipients who open your emails.
Why it’s tracked: It’s a directional read on subject lines and send timing — but read it with caution.
How to calculate: Email Open Rate = (Number of Opened Emails ÷ Total Number of Emails Sent) × 100
Benchmark: A typical cold email open rate is often cited at 15–25% — but open tracking has grown unreliable since Apple’s Mail Privacy Protection began auto-loading images and inflating opens. Treat open rate as a soft signal and lean on reply rate to judge whether messaging lands.
How to improve:
- Write subject lines that are specific and relevant, not clever for its own sake.
- Test send times against your audience’s actual schedule.
- Personalize the opening line so the preview text earns the open.
Email Response Rate
What it is: The percentage of recipients who reply — the real signal of whether your message resonates.
Why it’s tracked: Reply rate, not open rate, tells you if targeting and messaging are working.
How to calculate: Email Response Rate = (Number of Responses ÷ Total Number of Emails Sent) × 100
Benchmark: A solid cold email reply rate sits around 3–5%; above 8% is strong. Mind the trend, though — cold email reply rates have collapsed to just 5.1%, down from around 7% the previous year.
How to improve: (3)
- Lead with the prospect’s problem, not your product.
- Include one clear, low-friction call to action.
- A/B test the angle and offer, not just the wording.
LinkedIn Connection Request Acceptance Rate
What it is: The percentage of LinkedIn connection requests prospects accept.
Why it’s tracked: It reflects how well-targeted and relevant your LinkedIn outreach is.
How to calculate: LinkedIn Connection Request Acceptance Rate = (Number of Accepted Connections ÷ Total Number of Connection Requests) × 100
Benchmark: A good acceptance rate runs 30–40%.
How to improve:
- Personalize requests around a shared interest or mutual connection.
- Make sure your profile reads as credible before you reach out.
- Engage with a prospect’s content first to warm the introduction.
Average Number of Daily Dials
What it is: The number of outbound calls an SDR makes — a baseline activity measure.
Why it’s tracked: It sets a floor for effort, and it’s the metric behind every “How many calls should an SDR make a day?” debate. But on its own it’s a vanity number; volume only matters if it produces conversations.
How to calculate: Daily Dials = Number of Calls per Month ÷ Number of Working Days
Benchmark: Most outbound SDRs land around 50-80 calls daily, while inbound-focused reps might make 30-50 — but the exact number matters far less than the connect and meeting rates those dials produce.
How to improve: (5)
- Set realistic daily targets, then coach to conversation quality — not raw count.
- Keep call lists tight and verified to raise the odds of a live connect.
- Use dialer technology to cut idle time between calls.
Call Connection Rate
What it is: The percentage of dials that reach a live prospect.
Why it’s tracked: It exposes list quality and timing — low connect rates are usually a data problem, not an effort problem.
How to calculate: Call Connection Rate = (Number of Connected Calls ÷ Total Number of Outbound Calls) × 100
Benchmark: For cold outbound, expect roughly 5–12%. It takes 18 or more dials to connect with a prospect by phone, so a connect rate below ~3% almost always points to bad phone data or poor timing.
How to improve: (6)
- Call when prospects actually pick up — test early mornings and midday windows.
- Use verified, segmented lists with accurate direct-dial numbers.
- Open with a relevant, human first line to keep them on the call.
Prospect to Lead Ratio
What it is: The percentage of contacted prospects that convert into qualified leads.
Why it’s tracked: It’s a direct read on data quality and prospecting precision.
How to calculate: Prospect to Lead Ratio = (Number of Leads ÷ Total Number of Prospects Contacted) × 100
Benchmark: A healthy ratio typically runs 10–15%.
How to improve:
- Focus on high-fit accounts that match the ICP, not just reachable ones.
- Tailor messaging to specific pain points by persona.
- Use data analytics and buying signals to prioritize prospects with the highest conversion potential.
Signal-driven prospecting — using buying-intent data to target decision-makers in the purchasing process — has helped us double our clients’ SQL conversion rates. Learn more about how it works.
Booked Meeting Ratio
What it is: The percentage of outreach that results in a scheduled meeting.
Why it’s tracked: For most SDR teams, booked meetings are the primary output — the metric quota usually rides on.
How to calculate: Booked Meeting Ratio = (Number of Meetings Scheduled ÷ Total Number of Prospects Contacted) × 100
Benchmark: A booked-meeting ratio of 2–5% of prospects contacted is typical. Zooming out, the typical outbound SDR books 12-15 qualified meetings per month, while inbound reps handling warm leads often hit 20-25.
How to improve: (5)
- Build outreach around a clear, prospect-specific value proposition.
- Offer flexible scheduling and confirm promptly to protect show rate.
- Follow up diligently — most meetings are booked on a later touch, not the first.
- Offer value up front — a complimentary analysis or free session can lift booking rates that stick.
At Martal, we’ve helped our clients triple their number of booked appointments by offering Lunch and Learn meetings — on us.
Booked-meeting ratios look abstract until you see them at volume. In one three-month outbound program for a freight technology company entering new markets, our team delivered 108 booked meetings — evidence that a tight ICP and a coordinated omnichannel cadence can compress months of pipeline-building into weeks.
Meeting Show Rate (new — the metric most dashboards forget)
What it is: The percentage of booked meetings that prospects actually attend.
Why it’s tracked: Booked meetings only count if they happen. A big booking number with a weak show rate overstates real pipeline.
How to calculate: Meeting Show Rate = (Number of Meetings Held ÷ Number of Meetings Booked) × 100
Benchmark: Outbound show rates [are] typically 75-80%. Below ~70%, your qualification or confirmation process needs work.
How to improve: (4)
- Confirm with a reminder sequence across email and calendar.
- Qualify on genuine interest, not just willingness to book.
- Restate the value in the reminder so the prospect remembers why they said yes.
SDR Inbound Activity Metrics
Inbound metrics measure how well SDRs capitalize on the leads marketing generates — demo requests, content downloads, webinar sign-ups. Our deepest expertise is outbound, so we’ll keep this section grounded in current benchmarks and the qualification discipline that carries across both motions. One thing holds regardless of source: inbound conversion lives or dies on speed and qualification, and both swing far more than outbound because intent varies so widely from one channel to the next.
Lead Response Time
What it is: How quickly an SDR follows up with an inbound lead after the inquiry.
Why it’s tracked: Speed is one of the strongest predictors of inbound conversion — interest decays fast.
How to calculate: Lead Response Time = Total Time to Respond to All Inbound Leads ÷ Total Number of Inbound Leads
Benchmark: Respond within 5 minutes — leads contacted within five minutes convert at dramatically higher rates than those left waiting. The gap between best practice and reality is enormous; by one measure, the average lead response time takes 47 hours. Beat the field on speed and you win meetings competitors never get a shot at.
How to improve: (5)
- Route and alert in real time so no inbound inquiry sits unseen.
- Prioritize follow-up by intent — a demo request outranks an ebook download.
- Set and track a response-time SLA per rep.
Lead Qualification Rate
What it is: The share of inbound leads that meet your qualification criteria.
Why it’s tracked: It measures inbound lead quality and how well SDRs separate real fit from noise.
How to calculate: Lead Qualification Rate = (Number of Qualified Inbound Leads ÷ Total Number of Inbound Leads) × 100
Benchmark: Typically 20–40%, depending heavily on lead source and intent.
How to improve:
- Concentrate demand-gen on the channels that historically produce qualified leads.
- Qualify on authority and need, applied consistently — the same discipline that governs strong outbound qualification.
- Give marketing structured feedback on which sources convert, so the top of the funnel improves over time.
Inbound Conversion Rate
What it is: The share of qualified inbound leads that take a desired action — booking a meeting or converting.
Why it’s tracked: It’s the clearest measure of how well SDRs turn inbound interest into pipeline.
How to calculate: Inbound Conversion Rate = (Number of Converted Inbound Leads ÷ Total Number of Qualified Inbound Leads) × 100
Benchmark: Highly intent-dependent. High-intent inbound leads like demo requests and pricing page visits convert at 75-80% lead-to-meeting, while low-intent inbound like ebook downloads and webinar attendees converts at just 5-10% lead-to-meeting. A blended 15–30% is common, but the average hides that spread — segment by source before judging performance.
How to improve: (4)
- Triage by intent so high-intent leads get an SDR’s fastest, most personal response.
- Align messaging from the first marketing touch through SDR follow-up so momentum doesn’t break.
- Use the qualification conversation to advance the deal, not just confirm fit.
From an execution standpoint, the most common inbound mistake isn’t a low conversion rate — it’s treating every inbound lead the same. A high-intent demo request and a gated-ebook download are not the same lead, and folding them into one blended number hides the rep who’s fast on the ones that matter. Segment first, then optimize.
Managing SDRs to Their KPIs — Without Burning Them Out
KPIs cut both ways. Used well, they’re a coaching tool that shows a rep exactly how to win. Used badly, they become a daily scoreboard that grinds people down — and the SDR seat is already one of the highest-turnover roles in sales, with SDR tenure [around] 1.9 years. The teams that keep talent treat metrics as a map, not a hammer. A few principles: (4)
Set Clear, Realistic KPI Targets
Reps can’t hit a number they don’t understand or never had a fair shot at. Set specific, measurable targets, then sanity-check them: if fewer than half the team is clearing quota, the target is usually the problem, not the people. Build ramp expectations in for new hires, and revisit goals as the market shifts rather than letting a stale quota quietly demoralize the team.
Coach With the Numbers, Don’t Punish With Them
The fastest way to burn out an SDR is to wave a dashboard at them without showing them how to move it. Pair every metric with a path to improve it — if connect rates are low, fix the data and timing before blaming effort. A supportive work environment, reasonable workloads, and access to mental-health resources aren’t soft perks; they protect the consistency that good KPIs depend on.
Relieve Pressure With Outsourced Support
When an in-house team is stretched thin, KPIs slip for a simple reason: there aren’t enough hours to work the list properly. Collaborating with outsourced SDRs adds dedicated capacity and specialized expertise, freeing your internal reps to focus on the highest-value conversations instead of grinding through volume. It’s one of the more practical ways to lift team-wide metrics without piling more pressure on the people you already have.
Build a Career Path
SDRs stay when they can see where the role leads. Clear promotion tracks, relevant training, and visible progression keep reps invested — and an invested rep is far more consistent against their numbers than one watching the door. Structured advancement is also how you develop internal talent into your next AEs and team leads.
Support your SDRs with Sales Enablement
Sales enablement is the set of tools, content, and data that help your team sell smarter — and it’s the lever that moves almost every KPI in this article. Better data lifts deliverability and connect rates; better content lifts reply rates; better targeting lifts the prospect-to-lead and booked-meeting ratios. Adapting outbound best practices to meet prospects at each stage is central to any enablement program — SDRs need current research, messaging, and lists to perform.
A working enablement stack usually includes:
- Automated, well-sequenced outreach
- Real-time performance reporting
- A library of proven templates
- Client case studies and proof points
- Accurate, current prospect lists
Of these, prospect lists are the most resource-intensive to build well — and the most directly tied to your activity metrics. Here’s where strong prospect data comes from.
Where SDRs Can Source the Best Prospect Lists
Outsourced Research Teams
An outsourced sales team can do more than send outreach — it can build the detailed, accurate prospect lists that everything else depends on. This is one area we work in directly, and the difference between a generic list and a researched, qualified one shows up immediately in connect rates and reply rates. A strong outsourced research function uses specialized tooling to identify best-fit buyers and verify their data before a single touch goes out — often the fastest way to fill a pipeline with qualified leads rather than noise.
Databases and Platforms
SDRs can also build precise, high-quality B2B prospect lists using databases and platforms like ReachStream, which offer extensive contact profiles across industries for targeted prospecting with high data accuracy. For a deeper walkthrough on using ReachStream to build prospect lists, check out this tutorial. In practice, the strongest results usually come from combining sources — pairing the freshness of a continuously updated database with the depth and qualification a trusted research process adds.
The Bottom Line: Track Fewer, Better SDR KPIs
SDRs sit at the front of the revenue engine, so the metrics you put in front of them shape the pipeline you get. The mistake most teams make isn’t tracking too little — it’s tracking too much, and rewarding the wrong things. Activity numbers feel productive, but dials and emails are leading indicators; the metrics that actually predict revenue are qualified meetings held, conversion between stages, and pipeline created.
A simple diagnostic keeps a dashboard honest:
- High activity but few meetings → a conversion problem (data, targeting, or messaging).
- Plenty of meetings but little pipeline → a qualification problem (your bar is too low).
- Everything looks busy but revenue is flat → the wrong ICP, or an offer that isn’t landing.
Pick the handful of SDR KPIs that map to your model, define each stage precisely, and coach to the leading metrics while you evaluate on the lagging ones. That discipline — not more activity — is what separates teams that hit quota from teams that just look busy.If your pipeline numbers point to a targeting, qualification, or capacity problem, that’s exactly where an experienced partner earns its keep. Martal’s Sales-as-a-Service model pairs experienced onshore Sales Executives with our proprietary AI sales platform, running cold email, cold calling, and LinkedIn outreach as one coordinated omnichannel strategy — and reporting every metric in this article back to you, week over week. Trusted by 2,000+ B2B brands over 16+ years and ranked #1 in Lead Generation on Clutch, our team builds qualified pipeline you can actually measure. Book a consultation to see what a qualified pipeline looks like for your business.
References
- Crunchbase
- SaaStr
- Sales So
- Prospeo
- Tam To Target
- Persana AI
- Connect Salefy
- Zeliq
- First Page Sage
- VerifiedEmail
- Reachoutly
- Alsona
- Cognism
- Revenue.io
FAQs SDR KPIs
How many meetings should an SDR schedule?
For a fully ramped outbound SDR, 12-15 qualified meetings per month is the common 2026 benchmark, with top performers reaching 18–25; inbound reps often land 20–25 because warm leads convert faster. Ramping reps should target 8–10. But raw count misleads on its own — protect the show rate (75-80% is healthy) and watch how many meetings become real opportunities. An SDR booking 20 meetings at a 70% show rate yields fewer held meetings than one booking 15 at 90%. Set the target by working backward from your revenue goal and average deal size, not by copying another company’s number.
What’s a good cold call connect rate in 2026?
For cold outbound, a connect rate of roughly 5–12% is typical, and it takes 18 or more dials to connect with a prospect by phone. A rate below ~3% almost always signals a data or timing problem rather than rep effort — fix the phone data and call windows before adding dial volume. Connect rate matters more than dials made: 80 calls into disconnected numbers will lose to 40 calls against a clean, verified list. Test early-morning and midday windows, and segment lists so reps spend time on reachable, best-fit prospects.
What are the most important KPIs for SDR Services?
The SDR KPIs that matter most are outcome metrics: qualified meetings held, meeting-to-opportunity conversion, and pipeline created — plus the conversion rates between each funnel stage. Activity metrics like dials, emails, and connect rate are useful for coaching but shouldn’t be the headline; they’re leading indicators, not measures of success. A practical rule: if activity is high but meetings are low, you have a conversion problem; if meetings are high but pipeline is low, you have a qualification problem. Track a focused handful tied to your model rather than a bloated dashboard.
Why is meeting quality more important than volume?
A calendar full of poorly qualified meetings wastes your account executives’ time and erodes trust between teams. The best SDRs hold a meeting-to-opportunity ratio of roughly 1:3 to 1:5 — for every three to five meetings booked, one becomes a real opportunity. A high booking number paired with a low show rate or weak conversion overstates pipeline and hides the rep who’s booking the right meetings. Qualifying on genuine authority and need — not just willingness to take a call — is what turns meeting volume into measurable pipeline.
How many goals should a rep have?
Three is the sweet spot: one outcome metric (revenue or pipeline generated), one activity metric (meetings booked or pipeline coverage), and one development metric (win rate, speed-to-lead, or forecast accuracy). Fifteen goals means zero focus — reps quietly optimize for whatever’s easiest to game. Tying SDR KPIs to a small, balanced set keeps daily behavior pointed at the outcomes that matter while still giving you leading indicators to coach against week to week.