Cost Per Lead by Industry: 2026 Benchmarks & Actionable Strategies
Major Takeaways: Cost Per Lead by Industry
Average cost per lead by industry ranges from under $100 in e-commerce and local services to nearly $1,000 in higher education, reflecting massive differences in competition, deal size, and buyer complexity.
There isn’t one reliable number. The widely circulated ~$198 “average” traces to a 2017 survey; current 2026 data puts blended CPL between $91 (e-commerce) and $982 (higher education), so benchmark against your industry, not a global mean.
Higher education, financial services, legal services, and manufacturing consistently rank among the highest CPL industries due to long sales cycles, regulatory constraints, and high customer lifetime value.
E-commerce (~$91), HVAC (~$92), and other broad-market or local industries stay below $100 thanks to short buying cycles and scalable digital channels.
Across nearly every industry, organic CPL runs 40–60% below paid. In B2B SaaS the gap is widest — about $164 organic versus $310 paid.
Channel choice can swing CPL by 25x — referrals (~$25) and SEO/retargeting (~$31) sit lowest, while LinkedIn ($110+), PPC, and trade shows (~$811) sit highest.
No. A higher CPL is strategically sound in high-deal-size industries, as long as lead quality and conversion rates support a healthy LTV-to-CAC ratio.
Cost per qualified lead (CPQL). A $50 lead is costly if few qualify, while a $300 lead can be a bargain if most convert — winning teams measure CPL and CPQL together.
Introduction
Why does a lead cost $90 in one sector but $900 in another? As B2B sales and marketing leaders, we know cost per lead by industry isn’t a vanity metric – it’s a strategic compass. The price you pay to acquire a lead can swing more than 10x between industries, reflecting differences in competition, deal size, and marketing tactics. First Page Sage’s data shows e-commerce leads averaging around $91 while higher education leads climb to nearly $982 (1) – the widest industry spread on record. Understanding those gaps is what separates a defensible budget from a number you pulled off a recycled benchmark chart.
We built this guide to help B2B leaders benchmark CPL against the right peer set, understand what actually drives the variance, and bring their own cost per lead down without trading away lead quality. To do that, we pulled the most current industry and channel data, cross-referenced it against multiple sources, and interpreted it through what we see every day running outbound campaigns for B2B clients. Here’s how the numbers break down – and what to do about them.
What Is Cost Per Lead (CPL) and Why It Matters
Current CPL benchmarks range from $91 to $982 per lead depending on industry.
Reference Source: First Page Sage
Cost Per Lead (CPL) is a metric that tells us one thing: How much are we investing to acquire each lead? It’s calculated with a simple formula:
CPL = Total Marketing Spend ÷ Number of New Leads Generated (2).
If you spend $5,000 on a campaign and generate 100 leads, your average CPL is $50. This figure encompasses all your marketing costs (ad spend, content creation, events, etc.) divided by the leads those efforts produced. It’s a straightforward equation, but its implications run deep for B2B marketing and sales.
Tracking CPL matters because it directly measures marketing efficiency. Unlike vanity metrics (impressions or clicks), CPL ties dollars to outcomes – it answers whether your marketing dollars are generating prospective customers at a sustainable rate. Lowering CPL means you’re getting more leads for each dollar spent, which can signal efficient targeting or cost-effective channels. Conversely, a rising CPL may warn that outbound campaigns are becoming less efficient (due to saturation, competition, or fatigue).
CPL is not the same as customer acquisition cost (CAC). CPL measures the cost to acquire a lead, while CAC measures the cost to acquire a paying customer (2). CAC is always higher – not every lead converts to a sale. But CPL is a leading indicator: if your cost per lead is sky-high, your cost per customer will be steeper still. There’s a third number that matters even more, and most teams skip it: cost per qualified lead (CPQL) – what you actually pay for a lead that’s sales-ready. A cheap CPL that produces leads sales never converts isn’t cheap at all; the cost just moves downstream where it’s harder to see. We’ll come back to CPQL later, because it’s where the real efficiency conversation happens.
Why does CPL matter by industry? Simply put, your industry defines your playing field. A “good” CPL in one sector might be abysmal in another. For example, an enterprise software firm might gladly pay $200 for a qualified lead, whereas an e-commerce retailer selling low-cost items could never sustain that. Industry benchmarks help set realistic expectations – they prevent, say, a CMO in the legal industry from comparing their $600 CPL to a colleague’s $60 CPL in retail. Instead, you compare against your peers. Throughout this guide, we’ll use industry-specific data (including Martal’s own insights and third-party research) to help you gauge where you stand and how to improve. For a deeper introduction to CPL and industry budgeting, see our detailed guide on cost per lead here.
One caveat on the formula: most teams undercount their own CPL. The honest calculation includes more than ad spend – content production, tooling, events, and the labor hours behind the campaign all belong in the numerator. Leave out people costs and you can understate true CPL by 30–50%, which makes every benchmark comparison meaningless. When you compare your CPL to the figures below, make sure you’re comparing fully-loaded cost to fully-loaded cost.
Why Cost Per Lead Varies by Industry
On Google Ads specifically, legal services carries one of the highest costs per lead (~$131), while automotive repair runs as low as ~$28 – a 4–5x gap on a single channel.
Reference Source: Flyweel Research
No two industries are the same when it comes to generating leads. We’ve seen this firsthand at Martal Group – the challenges of sourcing leads for a niche B2B software vendor differ drastically from, say, running broad marketing for a real estate agency. Several core factors drive these differences in cost per lead by industry:
1. Market Competition & Demand
Industries with fierce competition invariably see higher lead costs. When dozens of companies fight over the same prospects, advertising bids shoot up and audiences become saturated. Think of legal services or insurance – keywords like “corporate lawyer” or “business insurance” are notorious for expensive pay-per-click rates, which translate into high CPLs. One analysis of Google Ads found legal services had the highest CPL (~$131) among B2B industries, while automotive repair had one of the lowest (~$28) (3). The difference? Legal firms outbid each other for a limited pool of high-value clients, whereas an auto repair shop often operates locally with less online competition.
High-demand industries also tend to invest heavily in marketing, driving up average CPL. Sectors like finance, software, and healthcare often have well-funded players all vying for attention. More competition means higher cost per impression, click, and ultimately lead. By contrast, if you operate in a niche with few competitors (or where marketing isn’t as aggressive), you may enjoy relatively cheap leads.
Tip: If you’re in a competitive space, focus on differentiation and smarter targeting. Outbidding rivals in Google or LinkedIn ads will escalate CPL quickly. Instead, consider niche keywords, long-tail content, or alternative channels where competition is lighter. Sometimes the best way to cut CPL is to zag where others zig – e.g. using thought leadership content or referrals in an industry obsessed with paid ads.
2. Sales Cycle Length & Nurturing Complexity
The length and complexity of your sales cycle profoundly impact CPL. In industries with long B2B sales cycles – enterprise software, industrial equipment, etc. – leads require more touches and nurturing. Multiple decision-makers, product demos, trials, and lengthy negotiations are common. Each of those touchpoints (webinars, sales calls, nurture emails, etc.) incurs cost. By the time a lead is sales-ready, a substantial marketing investment has been made, reflected in a higher cost per lead.
Contrast this with a short sales cycle environment. For example, in B2C e-commerce or simple SaaS apps with free trials, a lead might convert after just one or two interactions (an ad click and a landing page signup). Less nurture means lower cost. Our research shows that industries with immediate or urgent needs (like emergency home services, basic consumer products) can generate sales leads quickly and cheaply. In fact, “quick win” channels such as retargeting ads or Google search work well when customers decide fast – these channels average as low as $31 per lead because the funnel is so short (5).
On the other hand, industries like enterprise IT or finance not only have long cycles but also cautious buyers. Marketing spends a lot on content (whitepapers, case studies) and personal outreach to educate and build trust over months – all adding to CPL. It’s no surprise that financial services leads cost over $650 on average (5), or that manufacturing equipment leads run above $550 (5). These buyers move slowly and require hand-holding, which drives up marketing costs per acquired lead.
Insight: If your industry inherently requires a long nurturing process, accept that CPL will be higher – but focus on efficiency of each stage. Optimize your funnel: use marketing automation to nurture leads at scale (lower cost than manual outreach), qualify leads early so sales doesn’t waste time, and align marketing-sales efforts so no lead is lost. A long cycle doesn’t have to mean an astronomical CPL if managed well.
3. Customer Value & Willingness to Pay
Another major factor is the lifetime value (LTV) of a customer in your industry. If one new customer is worth $50,000 in revenue (common in B2B tech or consulting), companies are naturally willing to spend more to acquire that lead. In high-LTV industries, a CPL of $500 might be perfectly acceptable, even efficient, if say 1 in 5 leads closes and yields that $50k deal. In contrast, if a new customer is worth only $500 (e.g. an SMB SaaS subscription or consumer retail purchase), you can only justify a tiny fraction of that on acquiring a lead.
Industries like Higher Education illustrate this: a university might earn tens of thousands in tuition from one enrolled student, so spending nearly $1,000 to generate an enrollment lead can make sense (5). Similarly, Oil & Gas or IT services companies often have huge contract values – their average CPL in the ~$500–$600 range (1) is high in absolute terms, but relative to a six- or seven-figure deal, it’s a reasonable investment.
What this looks like in practice: In one engagement with a financial services brokerage – one of the highest-CPL categories on the chart – our team engaged 2,316 prospects over three years and delivered 1,219 SQLs and 832 booked meetings, a 52% lead-to-SQL qualification rate. The lesson isn’t that the leads were cheap; it’s that in a high-LTV category, disciplined qualification is what makes a higher cost per lead pay off. View the insuretech and financial services case study.
On the flip side, low-margin or lower-priced sectors must keep CPL down to survive. E-commerce retail has tight margins, so with an average CPL around $91 (5), those businesses thrive by acquiring leads cheaply via mass marketing and automation. If an online store spends even $200 to get a lead who makes a one-time $100 purchase, that’s a losing proposition. Thus, industries with smaller deal sizes tend to lean heavily on organic marketing, virality, and lower-cost channels to maintain a sustainable CPL.
Key point: “Good” CPL is relative to what a lead is worth. We often advise clients to calculate a target CPL based on their LTV:CAC ratio goals. A common benchmark is an LTV to CAC ratio of 3:1 or better (3). If you know your lead-to-customer conversion rate, you can work backwards to a target CPL. Here’s the formula we use with clients:
Max CPL = (Customer LTV ÷ Target LTV:CAC ratio) × Lead-to-customer conversion rate
Say a customer is worth $10,000, you want a 3:1 LTV:CAC ratio, and 1 in 10 leads becomes a customer. Your maximum CAC is $3,333 ($10,000 ÷ 3), and at a 10% conversion rate that puts your ceiling at roughly $333 per lead. Nail down those three inputs and you stop guessing whether a benchmark CPL is “good” – you know your own number.
4. Dominant Marketing Channels in the Industry
The marketing channels that prevail in your industry will heavily influence CPL. Some industries lean into channels that are inherently costly per lead; others exploit more cost-effective avenues.
For example, many traditional B2B sectors (manufacturing, construction, aerospace) still rely on trade shows, conferences, and events to generate leads. These are effective for face-to-face relationship building, but they come at a steep price – events and trade shows have an average CPL of about $811, the highest of all channels (4). If your industry expects you to have a booth at the big annual expo or sponsor niche events, your average lead cost will include those big-ticket spends. It’s no coincidence that industries like Manufacturing or Industrial IoT show very high blended CPLs in the $500+ range (1).
In contrast, sectors that successfully harness inbound marketing and digital channels often see lower CPLs. Take technology startups or digital services – these companies excel at content marketing, SEO, email campaigns, and social media. Online retargeting and SEO are among the cheapest lead sources (roughly $31 per lead on average) (5), and email marketing isn’t far behind (~$53 per lead) (5). An industry that generates a large portion of leads through organic search or email newsletters will naturally report a much lower CPL than one dependent on paid ads.
Let’s look at LinkedIn vs. Google Ads as a microcosm: LinkedIn is a favored channel for many B2B industries (like SaaS, consulting, enterprise software) because of its precise targeting – but that precision comes at a premium. Recent data shows LinkedIn leads often cost over $110 each, significantly higher than Google Search leads (around $70) (3). If your industry relies on LinkedIn for quality over quantity, your average CPL will skew higher. On the other hand, an industry heavily using search ads or SEO might enjoy more moderate costs.
To make the channel spread concrete, here’s roughly what a lead costs by channel – the same lead can cost 25x more depending on where it comes from:
Cost Per Lead by Channel (2026)
Channel
Approx. Cost Per Lead
Referrals & word-of-mouth
Lowest — often near-free
Online retargeting & SEO
~$31 (5)
Email marketing
~$53 (5)
Google Search / PPC
~$70 (3)
LinkedIn Ads
$110+ (3)
Trade shows & events
~$811 (4)
Industry examples:
- Real Estate: Relatively moderate CPL (~$448 (5)) in part because agents and firms leverage lots of inbound channels (SEO for local searches, Zillow, social media) rather than just pricey ads.
- Software/SaaS: Many SaaS firms use content marketing (blogs, webinars) to draw in leads cheaply over time, balancing their higher CPL channels. B2B SaaS averages around $237 per lead (5) – not low, but they mitigate costs with free inbound leads from SEO and product trials.
- Legal Services: Heavy reliance on Google Ads and referral networks drives their CPL up (averaging $649 (5)). Lawyers often must pay to play in search results, and those clicks are expensive.
In summary, industries win or lose the CPL battle based on where they find prospects. If the norm is expensive channels (paid search, events, LinkedIn), expect higher costs. If your peers are milking lower-cost channels (SEO, email, content), the bar for a good CPL will be lower. Part of our approach when consulting clients is to borrow tactics from lower-CPL industries – e.g., bringing more inbound/content strategy into a field that has so far relied on brute-force outbound. Over time, shifting your channel mix can significantly reduce your cost per lead.
5. Regulatory and Market Constraints
Lastly, consider external factors like regulations, market size, and audience accessibility. Some industries face advertising restrictions or privacy regulations that make lead generation tougher. For example, companies in healthcare, financial services, or education often must navigate strict rules (HIPAA, FINRA, FERPA, etc.) which limit targeting options or messaging. This can force heavier spending on compliant marketing channels and data, nudging CPL upward. Higher Ed is a case in point: recruiting students is heavily regulated in terms of data use and often requires expensive, compliant outreach methods – contributing to that ~$982 CPL figure (5).
Market size also matters. A niche B2B product (say a specialized engineering component) has a very limited pool of potential leads globally. Finding and reaching each prospect is like finding a needle in a haystack – it might involve purchasing expensive industry lists, attending specific trade events, or investing in account-based marketing. All of that means higher cost per lead. In contrast, mass-market products have a huge audience; you can cast wider nets and still pull in leads at a low cost due to scale. Broad markets = economies of scale in lead generation.
Finally, geography and global markets influence CPL. If you’re targeting regions with high advertising costs (like North America or Western Europe), you’ll likely pay more per lead than if targeting emerging markets with cheaper ad inventory. Many global companies see varied CPL by region, even for the same industry. For example, a tech firm might find leads in the U.S. cost 2-3x what they pay in certain APAC or LATAM countries. Industry benchmarks often assume a primary market (e.g., U.S./global) – keep your own geographic mix in mind when comparing figures.
Bottom line: Each industry operates under unique constraints. Understanding what external factors (regulations, market breadth, regional costs) are at play in your field will help contextualize your CPL. It might also reveal opportunities – e.g., if digital ads are saturated in your market, perhaps partner marketing or referrals (less regulated) could be a cost-effective alternative. Or if your domestic CPL is sky-high, exploring leads in international markets might broaden your lead generation funnel at a lower cost per lead.
With these factors in mind, let’s look at the hard numbers. How do industries stack up in 2026? The next section provides a detailed benchmark of average CPL by industry, along with analysis of the highest and lowest-cost environments.
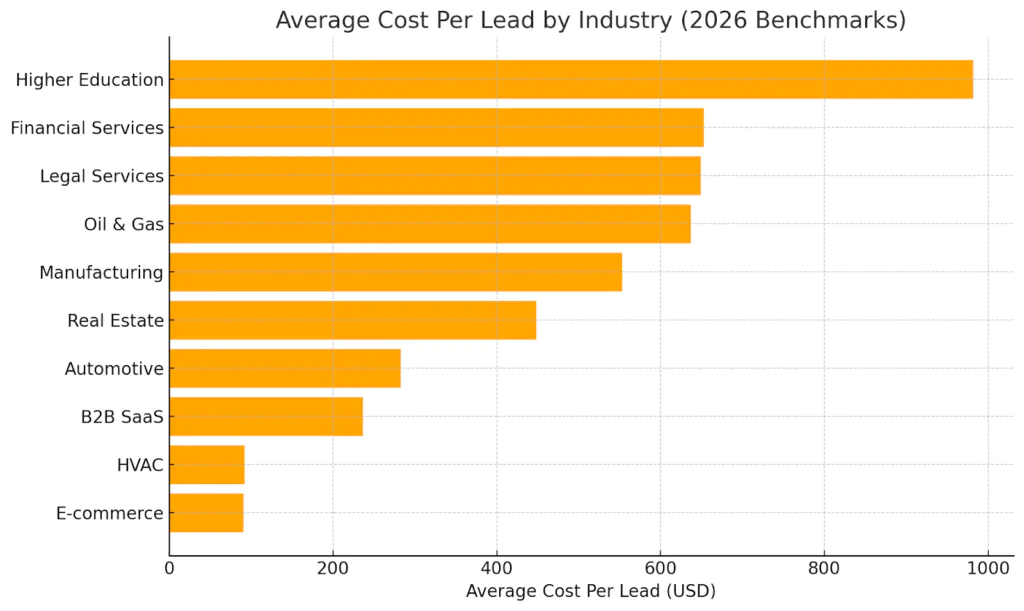
Average Cost Per Lead by Industry: Paid vs. Organic Benchmarks (2026)
B2B SaaS averages $237 per lead blended – but that splits into $310 on paid channels versus $164 organic, an 89% gap that explains why your channel mix matters as much as your industry.
Reference Source: First Page Sage
To build this benchmark, we pulled First Page Sage’s dataset – 30 industries, with paid, organic, and blended cost per lead broken out separately – and cross-referenced it against other current sources. We’re showing all three figures on purpose: the blended number is what most articles quote, but the paid-vs-organic split is where the real budgeting decisions live. Remember these are aggregates – your own numbers will vary by company size and region – but they’re the right reference point for what’s typical in each sector right now.
Source: Average Cost Per Lead by Industry, Amra & Elma
Higher Education leads all industries with an average CPL nearing $1,000, while E-commerce and HVAC enjoy some of the lowest CPLs around $90. Most B2B industries fall somewhere in between – e.g., B2B SaaS averages ~$237 per lead – depending on their market dynamics (5).
Average Cost Per Lead by Industry – Paid vs. Organic vs. Blended (2026)
Paid CPL
Organic CPL
Blended CPL
Higher Education
$1,261
$705
$982
Legal Services
$784
$516
$649
Financial Services
$761
$555
$653
Oil & Gas
$772
$502
$637
Software Development
$680
$510
$591
Transportation & Logistics
$670
$505
$588
Manufacturing
$691
$415
$553
IT & Managed Services
$617
$385
$503
Fintech
$490
$413
$452
Real Estate
$480
$416
$448
Cybersecurity
$411
$404
$406
Healthcare
$401
$320
$361
Automotive
$295
$271
$283
B2B SaaS
$310
$164
$237
HVAC
$115
$69
$92
E-Commerce
$98
$83
$91
Source: Average Cost Per Lead by Industry, First Page Sage. Figures are blended averages of paid and organic channels; actual results vary by company size and region.
A few observations from this data:
- Highest CPL industries are those offering high-value, often complex products or services. Higher Education is an outlier at the top – universities and colleges spend heavily on marketing and recruitment for each student. Close behind are Financial Services, Legal, Oil & Gas, Manufacturing, etc. These tend to be competitive B2B markets or sectors with big customer lifetime values. It’s not unusual for companies here to invest hundreds of dollars to land a single lead, because each converted lead (client) can be worth tens of thousands in revenue. As a CMO or sales VP in these fields, you’d want to compare your CPL against these benchmarks to ensure you’re in line. A legal firm with a $700 CPL, for instance, is in the expected range (the average ~$649 (5)), whereas a $200 CPL might indicate you’re outperforming peers – or possibly cutting corners on quality.
- Mid-range CPL industries include a broad mix. Real Estate around $448 per lead is notable – real estate companies (brokers, agencies, B2B real estate tech) generate leads through a mix of online ads and referrals, balancing costs. B2B SaaS at ~$237 is another benchmark; software companies often use scalable inbound marketing to keep costs reasonable, though enterprise SaaS can be higher. Automotive sector here (around $283) refers more to auto services or B2B automotive supply – consumer car sales leads can be a different ballgame but generally, auto services have tapped search and local SEO effectively, keeping CPL in check. If your industry isn’t at the extreme high or low end, you likely fall in this broad middle. A CPL of say $200 might be very high for one industry but excellent for another – context is key.
- Lowest CPL industries are typically B2C or broad-market fields. E-commerce’s ~$91 per lead is the lowest in this list (5) – online retailers benefit from huge customer bases and relatively inexpensive digital marketing (plus many “leads” come through organic search or social media for free). HVAC and Home Services also see low costs (~$92) because local businesses can generate leads via word-of-mouth, local SEO, and repeat customers at minimal marketing expense. We also see that Entertainment and Media companies tend to have lower CPLs (the entertainment industry average is around $114 (1)) since audience engagement on social platforms and content can be leveraged for leads cheaply. If you’re in a low CPL industry but your costs are higher than these benchmarks, it may signal inefficiencies – you should be capturing inexpensive leads if possible when the market allows it.
- There is no trustworthy single “all-industry average.” The figure you’ll see repeated everywhere – roughly $198 – traces back to a 2017 survey and tells you almost nothing, because it blends $91 e-commerce leads with $982 higher-education leads into a number that describes no real business. The honest takeaway: ignore the global mean and benchmark against your industry’s blended figure above. As the spread shows, “good” is entirely relative – a $400 CPL is a red flag in e-commerce and a win in oil & gas.
Let’s examine both ends of the spectrum a bit more, and discuss why certain industries incur the costs they do.
High-Cost Lead Industries (and Why They’re Expensive)
The industries with the highest CPL – higher ed, finance, legal, manufacturing, etc. – share some common traits as we discussed: high competition, high customer value, or heavy reliance on pricey channels.
- Higher Education (~$982/lead): Colleges and universities compete intensely to attract students (leads), and each enrolled student might bring in $50k+ tuition over time. Marketing channels include extensive digital advertising, education fairs, and agencies – all costly. Also, the decision cycle for students is long and involves many touchpoints (brochures, campus visits, email follow-ups), increasing the spend per prospect. The result is a sky-high CPL that few other sectors approach (5). Education marketers justify it with the high payoff per converted lead (student).
- Financial Services (~$653) & Legal Services (~$649/lead): These professional service industries face extremely high competition and keyword costs. A financial advisor or law firm might only win a small percentage of leads as clients, so their marketing spend has to cover a lot of “wasted” leads. They lean on Google Ads, LinkedIn, and referral fees – for example, personal injury law firms often pay for lead generation services or affiliates, which can run several hundred dollars per referral. The regulatory aspect (compliance ads, etc.) also limits cheap tactics. However, one closed client could be worth a huge fee, so firms tolerate a large CPL. Notably, these industries often also see lower conversion rates from lead to customer – one study found legal services leads converted at just ~5% while automotive leads converted at 14% (3), meaning lawyers must generate many leads to win one case. That drives up the effective CPL further.
- Industrial B2B (Manufacturing $553, Oil & Gas $637, IT/Managed Services $503, etc.): Heavy industry and enterprise technology leads are pricey because the audience is narrow and traditional. These companies rely on trade shows, industry publications, and direct sales outreach. Marketing might involve expensive technical content or on-site demos. Also, many of these sectors (energy, manufacturing, engineering) have fewer marketing-savvy players, meaning they often default to throwing money at lead gen rather than optimizing via digital. The complexity of products (e.g., a manufacturing system or an oilfield service) also means marketing departments invest more per lead to educate prospects. On the bright side, the deals here are large, so spending a few hundred per lead is acceptable if the close rates are decent.
- Business Services & Staffing (~$497): The average CPL for staffing and recruiting is around $497 (5), which might surprise some. The recruitment industry often pays for both inbound leads (e.g., companies needing hiring help) and outbound prospecting. It’s a very human-intensive sale – lots of personal outreach, relationship building, and sometimes paid lead brokers. B2B services like consulting or software development agencies similarly report CPLs in the high hundreds. With services, credibility and relationships matter, so firms invest heavily in content marketing, events, and networking to get a single qualified lead interested.
In summary, if you operate in a high-CPL industry, accept that your costs will be elevated, but focus on maximizing the quality and conversion of each lead. These industries can still have great ROI if your close rates and deal sizes justify the upfront expense. The goal is to be efficient relative to peers. If competitors are paying $600 per lead and you manage to average $400 with the same or better lead quality – you have a strong competitive advantage. Strategies like improving targeting, leveraging more inbound marketing, or using marketing automation to nurture leads can help chip away at those costs. We’ll delve into specific tactics to do this later in the guide.
Low-Cost Lead Industries (and Why They’re Cheaper)
On the other end, some industries consistently report low cost per lead. These are typically characterized by broad appeal, digital-native marketing, and short purchase cycles:
- E-commerce (~$91/lead): E-commerce companies enjoy one of the lowest CPLs (5) because of scale and digital efficiency. A “lead” in e-commerce is often just a website visitor who signs up or a prospective customer acquired via an ad click. With millions of potential customers online, e-commerce marketers cast wide nets using SEO, social media, and email. Many leads come essentially for free (organic traffic) or at very low cost (retargeting ads to website visitors, which are cheap). Additionally, e-commerce conversion funnels are highly optimized; if only 2-3 touches are needed to get a sale, marketing spends less per lead compared to complex B2B funnels. The result is a lean CPL. That said, e-commerce also tends to think in terms of cost per acquisition (CPA) more than leads, since transactions can happen quickly. But when they do capture leads (emails, newsletter signups), it’s often via inexpensive content or offers.
- Local Services (Home Services, HVAC ~$92): Many local service businesses have low CPLs (1) because they leverage community and organic channels. For instance, an HVAC contractor might get leads from local SEO (showing up on Google Maps), word-of-mouth referrals, or service directories – none of which cost much per lead. These businesses also often have repeat customers, meaning they aren’t always paying to acquire anew. Marketing spend is relatively low (maybe some local ads, a basic website, and referral incentives). Thus, the cost per new inquiry stays modest. If you’re a marketing leader in such an industry and seeing a very high CPL, it’s a red flag – you may be overspending on broad ads when local targeting or organic tactics could do the job at a fraction of the cost.
- Media & Entertainment (~$100-$120): Entertainment companies (streaming services, media outlets) reach huge audiences online. They thrive on content virality and social sharing, which means they can acquire leads (subscribers, sign-ups) cheaply. When 100,000 people can be reached with a single viral post or video, the “cost” of each lead approaching zero. Of course, not every campaign goes viral, but in general these industries rely more on content and less on paid acquisition, keeping CPLs on the lower side. They monetize attention at scale, so their marketing is geared toward volume.
- General B2C Products: Broad consumer products (apparel, food, personal services) often have moderate to low CPL because of mass appeal. They also might define “lead” loosely (a newsletter subscriber or coupon downloader) which can be gathered en masse through promotions. For example, an email list sign-up via a giveaway costs very little per lead and is a common tactic in B2C marketing.
If you’re in a traditionally low-CPL industry but finding your costs creeping up, ask why. Is competition rising? Are you relying too much on paid ads and not enough on organic growth? Often, the solution is to double down on what made these industries low-cost to begin with: community engagement, content marketing, referrals, and efficient digital funnels. You have the advantage of a broad audience – use it creatively rather than defaulting to expensive methods.
A word on company size: Regardless of industry, company size also influences CPL. Larger enterprises often pay more per lead than small businesses. Why? Big companies tend to target bigger clients (expensive to reach), use more formal and multi-layered marketing (which costs more), and frankly have the budget to spend. The data bears this out – cost per lead climbs steadily with company size: Part of it is efficiency and scrappiness at small scale, versus enterprise marketing bureaucracy at large scale. It’s something to keep in mind when benchmarking – if you’re a nimble startup comparing CPLs with a Fortune 500’s division, you should expect to be able to acquire leads much cheaper (and you’ll need to, to grow with limited funds). Conversely, if you’re an enterprise CMO, don’t be shocked that your CPL is higher than the startup world – focus on keeping it in line with enterprise benchmarks for your industry.
How to Use B2B Cost Per Lead Benchmarks in Your Strategy
An ideal LTV:CAC ratio for most businesses is at least 3:1 to ensure profitable customer acquisition.
Reference Source: Flyweel Research
Benchmark data is useful, but only if you apply it wisely. Here’s how experienced marketing and sales leaders can leverage industry CPL benchmarks:
1. Set Realistic Targets: Use the industry averages as a guidepost when setting your own CPL targets or KPIs. If the average CPL in your field is $300, setting a goal to get down to $50 is likely unrealistic (and might signal cut-rate tactics). Instead, aim to beat the benchmark by a reasonable margin. For instance, try to be 10-20% more efficient than the norm – a competitive advantage without chasing implausible numbers. Benchmarks give your CEO or board context as well; you can justify your budget by showing that “In our industry, leads typically cost ~$200. Our current CPL is $180, which is ahead of the curve.”
2. Diagnose Problems: If your CPL is significantly higher than the industry benchmark (and you’re comparing apples to apples in terms of lead definition), it flags an issue. Diagnose where the inefficiency lies. Is it a particular channel that’s dragging you down (e.g., maybe your Google Ads CPL is way above average)? Are you targeting too broad an audience and paying for unqualified leads? Or is your sales funnel leaking (lots of marketing spend but leads not converting)? Use benchmarks to pinpoint where you’re off. For example, if others in your industry get leads via LinkedIn at $100 and you’re paying $150, investigate your campaign structure or content on that platform specifically.
3. Focus on Cost Per Qualified Lead — Not Just CPL: A benchmark CPL is an average, not a verdict on lead quality. The metric the market is shifting toward – and the one we anchor on – is cost per qualified lead (CPQL): what you actually pay for a lead that’s sales-ready. It matters because cost compounds as a lead moves down the funnel:
Funnel Stage
What You’re Paying For
Cost Direction
Raw lead (CPL)
Contact info, minimal qualification
Baseline
MQL
Matches your ICP, shows intent
Higher
SQL / opportunity (CPQL)
Sales-ready, discovery done
Highest — often several times your raw CPL
The math is simple and unforgiving:
Effective CPQL = CPL ÷ % of leads that actually qualify
A $50 CPL sounds great until you learn only 5% of those leads qualify – that’s a real cost of $1,000 per sales-ready lead. Meanwhile a $300 CPL where 60% qualify costs just $500 per qualified lead. This is why lower CPL doesn’t always mean better if the leads don’t convert to revenue (5).
This is the part of the funnel we own. In one engagement with an AI knowledge-management platform serving manufacturing and field-service teams, we delivered 153 SQLs and 84 booked meetings from 362 leads – a 42% lead-to-SQL rate. The raw cost per lead was never the point; the qualified pipeline was. Track CPL, CPQL, and CAC together: CPL for front-end efficiency, CPQL for whether those dollars are buying real opportunities, CAC for what it costs to close. View the AI and machine learning case study.
4. Inform Budget Allocation: Industry CPLs by channel can guide where to put your next dollar. If you see, for example, that organic search leads cost far less than trade show leads in your industry, consider shifting budget toward SEO content or webinars and trimming some event spend. Of course, factor in lead quality (trade show leads might be fewer but higher intent). Still, knowing the cost dynamics helps optimize your marketing mix. Many marketers create a simple model: list all channels, list their CPL and conversion rates, then allocate budget to equalize the cost per customer across channels. If social media leads are twice as expensive as content leads for you, either improve your social strategy or reallocate funds to content where they work harder.
5. Justify Strategic Moves: As a sales or marketing leader, you sometimes need to advocate for strategic changes – maybe proposing an outsourced SDR team or investing in a new email automation platform. CPL figures can bolster your case. For instance, if your in-house outbound team’s CPL is $400 but industry average via specialized agencies (like Martal) is lower, you can build a case to outsource or get consulting to reduce cost per lead. Or if a certain new tool can drop your CPL by 15% through better targeting, calculate the dollar savings relative to the benchmark volume of leads. Speaking the language of CPL and ROI resonates with the C-suite; it ties marketing initiatives to financial outcomes directly.
In short, treat benchmarks as a compass, not a strict yardstick. They can tell you where you stand and where to look next, but your specific context will dictate the right decisions. Always define what a lead means for your business (MQL vs SQL, etc.) when benchmarking – consistency is key.
Next, let’s shift from analysis to action: given what we know, how can you actively lower your cost per lead? We’ll explore strategies that have proven effective across industries.
How to Lower Cost Per Lead Without Sacrificing Quality
Organic channels like SEO and retargeting deliver the lowest CPL, averaging around $31 per lead.
Reference Source: Amra & Elma
Reducing CPL isn’t about making cuts indiscriminately – it’s about optimizing your approach to get more bang for your marketing buck. Here are actionable strategies we’ve seen work for B2B companies, including our clients, to drive down cost per lead while keeping lead quality high:
- Optimize Your Channel Mix: Double down on the most cost-efficient channels for your industry. If search ads are yielding $70 leads and LinkedIn ads $110 leads (3), consider reallocating budget more toward search or SEO content which can bring in leads at a fraction of the cost. Many companies can significantly cut CPL by shifting from predominantly paid outbound to a healthier mix of inbound. For example, if you haven’t invested in SEO or content marketing yet, doing so can generate a steady flow of organic leads over time at a much lower incremental cost than paid campaigns. Pro tip: Identify one new low-cost channel to test each quarter – whether it’s an email newsletter, a partnership referral program, or organic LinkedIn content. Expanding your presence in a cost-effective channel can steadily bring your average CPL down.
- Invest in Inbound & Content Marketing: As the saying goes, content is the gift that keeps on giving. Creating high-quality content (blogs, whitepapers, webinars) and optimizing your website for search can attract leads essentially “for free” after the initial creation cost. The ROI of content tends to improve over time – an article that cost $500 to write might generate 50 leads a month via Google search, effectively a $10 CPL in the first month and dropping each subsequent month it continues to bring traffic. Additionally, content establishes trust, so the leads it generates often convert better (improving your CAC). Industries that traditionally relied on paid outreach can often slash CPL by building a content engine. This does require patience, as organic efforts take time. But 6-12 months into a solid content strategy, you could be generating a significant volume of leads at a fraction of your prior cost. Pro tip: Repurpose content across formats (turn a blog post into a short video or infographic) to capture leads on different platforms without starting from scratch each time.
- Improve Lead Targeting and Qualification: Wasted spend on unqualified leads is a silent CPL killer. Tighten up your targeting criteria in campaigns – use lookalike audiences, intent data, or account-based marketing (ABM) lists to focus on prospects who closely resemble your ideal customer profile. Yes, you might pay slightly more per click for narrower targeting, but if those clicks convert to leads at a much higher rate, your CPL and CAC improve. Similarly, implement better lead qualification early in the funnel. This could mean adding a qualifying question on your form (“How big is your team?” etc.), or using lead scoring to only pass genuinely interested leads to sales. By filtering out “junk” leads, you allocate your marketing dollars to those more likely to convert, effectively lowering the effective CPL for useful leads. In practice, we’ve seen clients reduce their CPL by 20-30% simply by cutting out lead sources or segments that consistently yielded low-quality contacts. It’s the classic case of “half the money I spend on advertising is wasted” – through smarter targeting, you eliminate more of that waste.
- Leverage Marketing Automation & AI: Efficient technology can reduce the manual cost of nurturing each lead. Tools ranging from email automation, chatbots on your site, to AI-driven ad optimization can incrementally chip away at CPL. For example, an AI-based ad platform might auto-adjust your bids to get cheaper clicks at times of day or devices that convert better, lowering cost per lead. Automated email workflows ensure that every lead is touched with a personalized sequence without a sales rep’s direct involvement – moving leads down the funnel at low cost. Over time, these efficiencies add up. One specific tactic: implement an AI-driven lead scoring system that identifies high intent leads faster (based on behavior or firmographic data) so your sales team focuses on closing those, while lower intent leads continue in automated nurture until they’re sales-ready. This maximizes the return on each lead generated.
- Outsource to Specialists (Smartly): Sometimes the fastest way to cut CPL is to bring in a team that’s already built the engine. Outsourced lead generation firms (like Martal Group) come equipped with tested outreach sequences, curated databases, and AI tooling – so you skip the months of trial-and-error that inflate an in-house team’s early CPL. By using a fractional sales development model, you convert high fixed costs (hiring, training, and ramping SDRs) into a variable cost that scales with results. Done right, outsourcing can cut lead generation costs by up to 65% versus building in-house, while ramping roughly 3x faster than onboarding a new internal SDR. We’ve found that partnering with an experienced outbound lead generation provider boosts pipeline while often lowering blended CPL, because the provider’s expertise yields higher connect rates and more qualified meetings.
The efficiency comes from running outreach as one coordinated omnichannel program – cold email, cold calling, and LinkedIn working together, not as disconnected point efforts. One example from our own work: in a three-month pilot for a B2B EDI software company, a single fractional rep delivered 14 SQLs, with the first two landing in week two. That’s the fractional model doing exactly what it’s built to do – qualified pipeline without the overhead of a full internal team. The key is fit: the provider has to align tightly with your ICP and messaging, because this isn’t about lead volume – it’s about qualified meetings. Track blended CPL over time to confirm you’re actually getting more efficient. - Train and Align Sales & Marketing Teams: It might not sound like a direct CPL tactic, but a well-trained Sales Development Rep (SDR) team and good sales and marketing alignment can drastically improve lead conversion, which in turn helps your CPL/CAC math. If your marketing generates 100 leads, but your sales team fumbles the follow-up on half of them, your effective cost per successful lead doubles. Investing in B2B sales training for your reps – teaching them how to engage leads promptly, personalize outreach, and nurture relationships – ensures that the hard-won leads are fully capitalized on. Moreover, align on lead definitions: ensure marketing and sales agree on what constitutes a qualified lead. When both teams operate in sync (what some call the “smarketing” alignment), fewer leads slip through cracks or stagnate. The result is a higher yield from the leads you already pay for, effectively reducing the waste and maximizing each lead’s value. While this doesn’t lower the upfront CPL, it improves your ROI per lead, which allows you to spend the same amount on leads with greater confidence of return. Over time, if sales can convert more leads to customers, you may even be able to justify spending more on leads (in higher quality channels) without hurting profitability – or maintain spend and simply grow faster.
- Continuously Track, Test, and Tweak: Lastly, an ongoing optimization mindset is key. Track your CPL by campaign, channel, and month. Identify trends – are costs creeping up on a certain platform? Did a new campaign cut CPL in one segment? Regular A/B testing can reveal what resonates best and yields cheaper leads. This could be testing different ad creatives, landing page designs, or call-to-action wording. Sometimes small tweaks (like a more compelling headline or a clearer form) can bump up conversion rates, effectively lowering CPL. We advocate for a monthly or quarterly CPL review where your team analyzes results and brainstorms at least one experiment to attempt. Over the course of a year, 4-5 successful experiments might reduce your CPL by 10-20%. For instance, one quarter you might test a referral incentive program (could bring in low-cost referral leads), another quarter you test a chatbot for quick website lead capture, and so on. Keep what works, scrap what doesn’t, and you’ll gradually build a highly efficient lead gen engine.
In applying these strategies, remember the mantra: lower cost per lead, but not at the cost of lead quality. The sweet spot is when you can trim the fat in your marketing spend while actually increasing the proportion of leads that convert into customers. It’s absolutely possible – we’ve seen clients achieve it by using a combination of the above approaches.
Next, let’s look ahead: what trends are shaping cost per lead as we move further into 2026 and beyond?
2026 Outlook: Trends Shaping Cost Per Lead
Google Ads’ average CPL rose from $66.69 in 2024 to $70.11 in 2025, a 5.1% year-over-year increase.
Reference Source: CausalFunnel
Staying ahead of emerging trends can help you proactively manage your CPL instead of reacting after the fact. Here are a few key trends in 2025–2026 that B2B leaders should watch, as they will influence cost per lead across industries:
- Rising Digital Ad Costs (and Competition): Paid CPLs have climbed steadily year over year. Google Ads’ average cost per lead rose from ~$66.69 in 2024 to $70.11 in 2025 (2) – a ~5% jump in a single year – with similar inflation across LinkedIn and Facebook as more advertisers crowd the platforms. The pressure isn’t easing: one analysis projects blended CPL reaching $240–$250 by 2030, though growth should decelerate as AI-assisted scoring and conversion-rate optimization absorb an estimated 30–40% of paid-channel inflation by 2028. Layer in third-party data deprecation (iOS changes, cookie restrictions) eroding targeting efficiency, and the direction is clear. Implication: Assume rising baseline CPLs in paid channels and budget for it. Counter it by leaning on owned media (content, SEO) that isn’t subject to auction inflation, and by lifting conversion rates so you wring more leads out of the clicks you already pay for – teams that hold their current channel mix steady will overspend by an estimated 15–20% within three years.
- Quality Over Quantity Focus: We anticipate more marketers shifting focus from sheer lead volume to lead quality. The era of bragging about thousands of “leads” (that sales never converts) is ending. Organizations are uniting metrics like CPL with customer acquisition cost and LTV for a holistic picture. In practical terms, you might see companies generating fewer leads than before but with higher intent – e.g., gating content more selectively or scoring leads rigorously and only counting the best ones. This might initially make CPL appear higher (since you’re intentionally filtering out cheap-but-low-quality leads), but it’s healthier for the business. Our advice: embrace this quality mindset. Educate stakeholders that a higher CPL can be a good thing if it correlates with a higher close rate and lower CAC. Already, 68% of marketers say improving lead quality is a bigger challenge than increasing lead quantity (4) – which is exactly why the CPQL lens we covered earlier is becoming the metric that matters. The teams winning aren’t chasing cheaper leads; they’re chasing leads that close.
- AI and Automation Driving Efficiency: The continued rise of AI in marketing and sales is poised to bring CPL efficiencies – for those who leverage it well. AI tools can optimize ad bidding in real-time, personalize content at scale, and identify the best leads for sales follow-up, all of which improve the cost-effectiveness of lead generation campaigns. In outbound, AI-driven prospecting (such as Martal’s proprietary AI SDR platform that analyzes intent signals) can pinpoint leads more likely to convert, so reps spend time on the right accounts. Over 2025–2026, expect AI to trim some fat from marketing spend by eliminating some trial-and-error. That said, everyone will have access to similar tools, so it could also raise the bar just to keep CPL steady (if your competitors adopt AI and you don’t, your CPL might rise relative to theirs). Implication: Invest in proven marketing AI where it can clearly automate laborious processes or enhance targeting. Even simple automation – like an AI that pauses low-performing ads – can save budget that goes toward productive leads instead. The companies who best combine human creativity with AI efficiency will likely gain a CPL advantage.
- Privacy Regulations and Data Challenges: Stricter data privacy laws (GDPR, CCPA, and emerging ones in other countries) are affecting lead generation tactics. It’s getting harder to use third-party data for targeting or to cold contact prospects without compliance steps. This trend means some traditional outbound tactics might yield fewer leads for the same effort, potentially raising CPL unless new approaches are found. We might see a resurgence of permission-based marketing – building your own lists through valuable content and events, rather than buying leads or scraping data (which is increasingly risky legally and less effective). While in the short term this can require more work and investment (thus higher CPL), in the long run it creates a more engaged audience and stable pipeline. Best bet is to stay ahead of compliance; use it as an opportunity to differentiate by trust. For example, being known as a brand that respects privacy and still provides value can make prospects more willing to engage (essentially raising conversion rates and offsetting higher costs to reach them).
- Continued Growth of Outsourced Sales Development: The sales outsourcing trend is growing as companies look to control costs and tap specialized expertise. Rather than build large internal SDR teams, many B2B firms are opting for Sales-as-a-Service models (like fractional SDR teams on demand). This allows for quick scaling and scaling down, and often a lower CPL because you’re leveraging an expert team that already has infrastructure in place. We foresee more companies taking a hybrid approach – a small in-house team plus external partners – to optimize lead generation. This could potentially lower average CPL industry-wide for those who adopt it, since specialized agencies often deliver leads more efficiently. If your competitors start outsourcing lead generation and sales and you don’t, you might find them achieving more outreach for the same budget. Of course, the key is choosing reputable partners and integrating them seamlessly with your sales process.
In essence, the future will reward marketers and sales leaders who are agile and data-driven. Cost per lead is not a static metric – it’s influenced by the macro environment (ad markets, technology, buyer behavior). Keep an eye on these trends and be ready to adapt strategies. For example, if you notice your CPL creeping up beyond industry trend lines, dig in to see if it’s due to one of the above factors and adjust course quickly.
Conclusion: Optimize Your CPL and Pipeline with the Right Partners
Managing cost per lead by industry is a continuous balancing act – you’re aligning your marketing investments with the realities of your market. We’ve seen that while benchmarks provide a compass, it’s the execution of smart strategies that truly drives results. By focusing on efficient channels, prioritizing lead quality, and staying agile with trends, you can keep your CPL in check and your pipeline full of good opportunities.
At Martal Group, this is the work we do every day. We help B2B companies build qualified pipeline through coordinated omnichannel outreach – cold email, cold calling, and LinkedIn lead generation running together as one program, not separate point efforts – with a constant eye on cost efficiency. Our onshore Sales Executives act as a seamless extension of your team, bringing 16+ years of expertise in sales and marketing outsourcing to lower the cost and time it takes to engage your ideal buyers.
Crucially, our approach isn’t about inflating lead volume – it’s about delivering sales-ready leads that convert. Using data-driven targeting and outreach sequences honed across 50+ verticals, we optimize for cost per qualified lead, not just cost per lead. For example, in a nine-year partnership with a marketplace client, our work helped generate $4.5M in recurring revenue at a 500% ROI. And we don’t stop at lead generation – we also offer B2B sales training and consulting so your in-house team is equipped to turn those leads into revenue.
Want to pressure-test your own numbers first? Try our outbound sales ROI calculator to forecast your business development costs for the next 12 months.
If your organization is looking to reduce your cost per lead and accelerate growth, let’s talk. We’ll assess your current lead generation strategy, share tailored insights for your industry, and show you what a qualified pipeline at a sustainable cost actually looks like. Schedule a consultation with Martal to get started.
In a competitive landscape, you don’t have to go it alone or overspend to keep up – with the right sales partner and strategy, you can outsmart and outperform.
References
FAQs: Cost Per Lead by Industry
How is cost per lead calculated?
Cost per lead uses a simple formula: CPL = Total Marketing Spend ÷ Number of New Leads Generated. Spend $5,000 and generate 100 leads, and your CPL is $50. The catch most teams miss: a complete calculation includes more than ad spend – content, tools, events, and the labor hours behind the campaign all belong in the total. Leaving out people costs can understate true CPL by 30–50%, which makes benchmark comparisons unreliable. For B2B, also track cost per qualified lead (CPL ÷ your qualification rate) to see what a sales-ready lead actually costs.
How much do leads usually cost?
Leads cost anywhere from under $100 in low-competition, broad-market industries (e-commerce, HVAC) to nearly $1,000 in higher education. Most B2B sectors land between $200 and $700 blended. The right benchmark is always your specific industry — a single cross-industry average hides a 10x-plus spread.
What is a good CPL?
A good CPL is one that supports profitable growth. If your cost per lead lets you maintain a strong LTV-to-CAC ratio (3:1 or better) and consistent pipeline velocity, it’s working — even if it’s higher than a competitor’s in another sector. Judge it against cost per qualified lead, not raw volume.
Is spending $100 per day for leads common, or is it too little/too much? How much do you all spend monthly for lead generation?
Spending $100 per day can be plenty in low-CPL industries but inadequate in competitive B2B sectors where a single lead can cost $300–$700. Monthly lead generation budgets vary widely, from a few thousand dollars to six figures, depending on industry, deal size, and growth targets.
What do companies usually pay per lead in B2B tech? I’ve heard LinkedIn CPL can be $75–$100+, does that sound right?
That’s in the right ballpark, and trending up. B2B tech blended CPL typically runs $150–$300, with B2B SaaS around $237. On LinkedIn specifically, current data puts CPL at $110+, reflecting precise decision-maker targeting and rising competition. LinkedIn leads often qualify at a higher rate, so judge the channel on cost per qualified lead.
My agency ran a campaign with $25/lead when the industry average was $120+, why did CPL increase when I doubled the budget?
CPL often increases with higher spend because initial budgets capture high-intent audiences first. As spend scales, ads reach less-qualified prospects, driving up average cost per lead.