Annual Contract Value Strategies for 2026 B2B Revenue Growth
Major Takeaways: Annual Contract Value
ACV is the average annual revenue from a single customer contract, normalized so a 1-year deal and a 5-year deal can be compared on equal footing. Across all companies in the SaaS Capital survey of 1,000+ private B2B SaaS companies, the median ACV is $26,265, up from $22,357 the previous year — and the trend is firmly upward. (3)
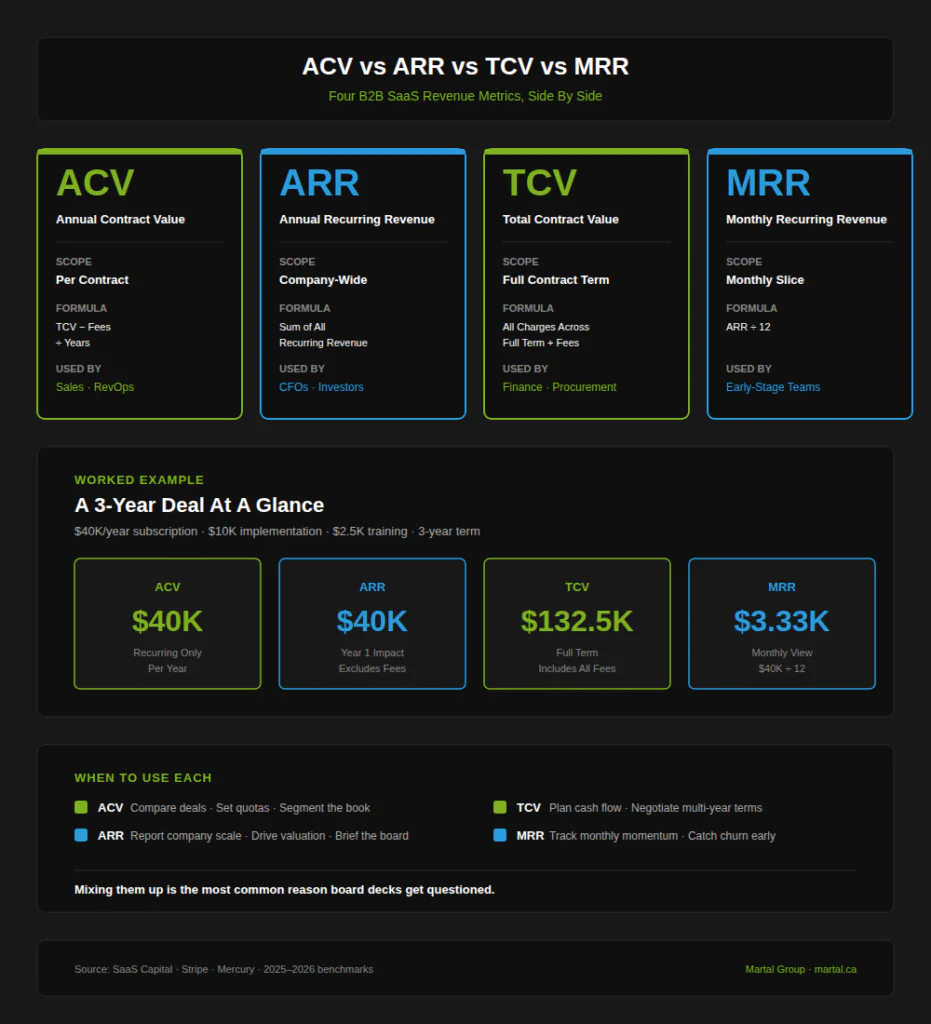
ACV is per contract, annualized. ARR is company-wide recurring revenue. TCV is the entire contract value over its full term, including one-time fees. MRR is the monthly slice of ARR. Mixing them up is the single most common reason board decks get questioned.
ACV = (Total Contract Value − One-time fees) / Number of years in the contract. A 3-year contract worth $300,000 with no setup fees has an ACV of $100,000. The same deal with a $30,000 implementation fee still has a $100,000 ACV — that fee belongs in TCV, not ACV.
SMB-focused SaaS: $5K–$15K ACV. Mid-market: $15K–$50K. Enterprise: $50K–$250K+. Larger ACV solutions also exhibit higher costs to acquire a customer, which need to be evaluated against retention, lifetime value, and growth rate to understand long-term impact. (12)
ACV-centric planning improves quota setting, pipeline prioritization, and resource allocation by focusing on revenue yield over deal count. It also exposes pricing pressure earlier — a growing pipeline with declining ACV often signals discounting or a downward shift in customer mix.
Through upsells, cross-sells, multi-year commitments, and tier upgrades. SaaS Capital research shows that improving Net Revenue Retention from the 90–100% range to 100–110% improves median growth rates by 5 percentage points — which is why expansion ACV is now where the smart money goes. (14)
Targeted outbound prospecting, multi-stakeholder personalization, and intent-based account selection — paired with disciplined qualification. The goal is fewer, better-fit conversations with accounts that can support six-figure annual commitments.
The most common mistakes: including one-time fees in ACV (or in ARR), treating gross ACV as net, and inflating averages with multi-year prepaid deals that distort year-over-year comparisons. We unpack each one in the “Common ACV Mistakes” section above.
Introduction
A single enterprise contract can outperform a year of SMB wins — but only if your team knows how to spot, close, and expand the deals that justify the effort. Annual Contract Value is the metric that tells you whether your pipeline is built on the right deals or just a lot of them.
ACV has moved well past the SaaS buzzword stage. It is now a core planning lens for VPs of Sales, CROs, CMOs, and Heads of Revenue who need to prove pipeline quality — not just pipeline volume — to their boards. A survey found that the median ACV reached $26,265, up from $22,357 the previous year (3), and the upward pressure is concentrated in mid-market and enterprise deals. At the same time, data also shows that ACV alone does not correlate with growth rate — what matters more is retention, expansion, and how efficiently you acquire each contract. ACV is the input. What you do with it is the strategy.This guide is built to help B2B revenue leaders evaluate, calculate, and act on ACV in a way that connects directly to pipeline decisions. We pulled together the most current benchmarks from SaaS Capital, Benchmarkit, and Stripe, compared them against patterns we see in our own outsourced sales and outbound lead generation work with B2B clients, and organized the findings around the questions buyers actually ask. You will get the definition, the formula, a clean breakdown of how ACV compares to ARR, TCV, and AOV, current benchmarks by company segment, the most common ways teams get ACV wrong, and practical strategies for raising it — including real outcomes from clients we have worked with.
What is Annual Contract Value (ACV)? Definition and Why It Matters
$26,265 was the median Annual Contract Value (ACV) for private B2B SaaS companies in 2024, up from $22,357 the prior year.
Reference Source: SaaS Capital
Annual Contract Value (ACV) is the average annual revenue generated from a single customer contract, normalized to a 12-month basis and typically excluding one-time fees (1). The simplest version of the ACV definition: it tells you what a contract is worth per year, regardless of how many years the contract spans.
If a customer signs a 3-year deal worth $300,000, the ACV is $100,000 per year (2). If another customer signs a 1-year deal worth $100,000, the ACV is identical — $100,000. That is the entire point of the metric. It strips out contract-length differences so that two deals that look very different on paper can be compared on equal footing.
ACV is not a standardized accounting metric. Definitions can vary by business — what matters is choosing a clear rule for what counts as recurring, applying it consistently across deals, and keeping that definition stable over time. Inconsistent ACV definitions across sales, finance, and marketing teams are a leading cause of board-deck disagreements, which we cover in the Common ACV Mistakes section below.
What does ACV actually tell you?
ACV answers four practical questions that raw bookings numbers cannot:
- Deal size on a like-for-like basis. A $500K, five-year deal and a $100K, one-year deal both contribute $100K in ACV — useful for comparing reps, segments, or campaigns without contract-length distortion.
- Pipeline quality. A pipeline growing in count but shrinking in average ACV usually signals discount pressure or a downward shift in customer mix. ACV catches this earlier than ARR does.
- Customer prioritization. High-ACV customers concentrate revenue. Most B2B businesses see Pareto patterns — a small share of accounts driving the majority of revenue — and ACV is what surfaces them. This is why customer success teams routinely tier their book by ACV bands and assign white-glove support to the top tier and scaled programs to the rest (1).
- Revenue planning math. If your average ACV is $50K and you need $5M in new business, you need 100 new deals at the current ACV — or 50 deals if you can move ACV to $100K. Same revenue, very different pipeline shape.
Why ACV matters for B2B revenue leaders in 2026
The ACV question is no longer “what is it.” It is “what should we do with it.” With economic pressure on every revenue line, sales leaders are using ACV as a pipeline-shaping tool, not just a reporting metric.
Three uses dominate right now. First, forecasting: ACV-weighted pipeline reviews give a sharper view of which combination of deals will hit quota than deal counts alone. Second, target-setting: ACV serves as the benchmark for the deals reps should be qualifying into the funnel — if your current ACV is $30K and you want to move up-market, ACV becomes the floor for what counts as a qualified opportunity. Third, resource allocation: a declining ACV is one of the earliest red flags in sales health (4), often appearing before pipeline volume drops or churn shows up in the data.
For sales leaders running outbound lead generation or working closely with lead qualification teams, ACV becomes the operating filter. It tells SDRs which prospects are worth a multi-touch sequence and which are better routed to lower-cost motions. It tells AEs which deals deserve executive engagement and which can be closed in a single demo cycle. And it gives finance a defensible basis for capacity planning that sales and the board can actually agree on.
ACV is not just a metric. It is the lens that translates revenue ambition into operational decisions.
ACV vs. ARR — Why These Two Metrics Get Confused
Annual Contract Value and Annual Recurring Revenue are the two most-confused metrics in B2B SaaS finance. They sound similar, they are both annualized, and they often produce numbers that look related — which is why founders, CFOs, and sales leaders routinely mix them up in board decks and forecasts. When founders get confused about ARR vs. MRR or ACV vs. ARR, they are usually mixing up scale, timing, and customer-level metrics.
Here is the distinction that actually matters: ACV measures the average annual value of a single customer contract. ARR measures the total recurring revenue across all customers in a year. ACV evaluates deal quality. ARR evaluates company scale. They answer different questions, and using one when you need the other will distort the answer.
ACV vs ARR at a glance
Aspect
ACV (Annual Contract Value)
ARR (Annual Recurring Revenue)
Scope
Per customer contract
Total across all customers
What it measures
Average annual value of one deal
Total predictable yearly revenue
Question it answers
“How much is this contract worth per year?”
“How much recurring revenue does the business generate?”
Includes one-time fees?
No — recurring revenue only
No — recurring revenue only
Used by
Sales leaders, RevOps, deal teams
CFOs, investors, board members
Best for
Deal sizing, quota-setting, segmentation
Valuation, forecasting, growth tracking
Standardized?
No — definitions vary by company
Yes — broadly accepted definition
Changes when
A new contract is signed or renewed at a different value
Customers join, churn, expand, or contract
A worked example: ACV and ARR in action
Imagine your business closes three new contracts this quarter:
- Customer A: $300,000, 3-year contract → ACV = $100,000
- Customer B: $24,000, 1-year contract → ACV = $24,000
- Customer C: $60,000, 2-year contract → ACV = $30,000
The average ACV across these three deals is $51,333. But the ARR contribution from these new contracts is the sum of their per-year values: $154,000 ($100K + $24K + $30K). Same three deals. Two very different numbers. Both correct. Each tells you something the other cannot.
If you reported $51,333 to your board as “new ARR this quarter,” you would be wrong by a factor of three. If you told your sales team their average deal size this quarter was $154,000, every rep on the floor would think they were closing enterprise deals when half of them are not.
When to use ACV versus ARR
Use ACV when you are evaluating sales performance. ACV by rep, by segment, by source, or by channel surfaces patterns that ARR cannot. If your inbound channel is producing $15K ACV deals and your outbound channel is producing $75K ACV deals, you have just learned where to invest your next dollar of pipeline spend. This is where curated outbound prospecting tends to pull its weight — outbound campaigns can be specifically targeted at high-ACV ideal customer profiles, while inbound naturally captures a broader and lower-ACV mix.
Use ARR when you are reporting company performance. Investors, lenders, and acquirers want a clean, comparable number that reflects the predictable revenue base of the business. ARR is that number. It also feeds directly into valuation multiples — private SaaS valuation multiples are stabilizing around 6–7× ARR, while top-quartile enterprise deals can command over 8× (8).
Use both when you are diagnosing growth. A common pattern: ARR is rising but average ACV is shrinking. That usually means you are adding more customers but each new customer is smaller. Sometimes this is intentional (a deliberate move down-market). Often it is unintentional (discount creep, weaker qualification, or a product-market shift). Either way, you only catch it by tracking both metrics together.
A useful sanity check: if you have 100 customers with an average ACV of $25,000, your ARR is approximately $2.5M — assuming all customers are on annual or multi-year terms and nothing has churned. If you have 100 customers with average $25K ACV, your ARR is approximately $2.5M, and if the average customer signed a 3-year contract, total TCV would be $7.5M (9). The three metrics nest together — ACV is the building block, ARR is the company-level total, and TCV is the multi-year picture.
One mistake worth flagging
The single most common reporting error is including one-time fees in ARR. Setup costs, implementation charges, training, and professional services all flow into TCV — but none of them belong in ARR (or in ACV, if you are calculating it cleanly). Counting them inflates the number and creates a forecasting trap that catches up with the team within two or three quarters. We unpack this and four other common mistakes in the Common ACV Mistakes section below.
ACV vs. AOV: Understanding the Difference
The global Average Order Value (AOV) across e-commerce platforms was $144.57 in late 2024, with U.S. online retail AOV averaging $153.21.
Reference Source: Opensend
Feature/Aspect
ACV (Annual Contract Value)
AOV (Average Order Value)
Definition
Revenue a customer generates per year of contract
Average amount a customer spends per transaction or order
Business Type
Subscription or contract-based (B2B SaaS, services)
Transactional (e-commerce, retail, SMB)
Metric Type
Rate metric (annualized)
Point-in-time metric (per order)
Example
$300K deal over 3 years → ACV = $100K/year
$100,000 from 1,000 orders → AOV = $100
Typical Deal Size
High-value, fewer deals (tens to hundreds of thousands)
Low-value, frequent transactions ($100–$150 per order)
Use Case
Revenue forecasting, account management, valuation
Checkout conversion, marketing efficiency, basket size
Frequency
Annually per customer
Per transaction
Real-World Benchmarks
Median B2B SaaS ACV ~$26,000
Global e-commerce AOV ~$145; U.S. online retailers ~$153
Strategic Focus
Big-picture revenue per account, long-term relationships
Per-sale value through upselling, bundling, basket design
Common Confusion
Sometimes mistaken for “Annual Order Value” in B2B contexts
Sometimes used to mean Annual Order Value, but usually per transaction
Sales and marketing leaders often ask how ACV compares to AOV — the two metrics sound parallel because both are “average value” calculations, but they belong to different go-to-market worlds. AOV is a point-in-time metric that answers “how much does a customer spend per purchase?” It is built for transactional businesses where success comes from optimizing each individual order. As of late 2024, the global e-commerce AOV was around $144.57 (3), and U.S. online retailers saw an average order around $153 (5). A higher AOV directly boosts profitability without needing more customers.
ACV is a rate metric that answers “how much revenue does a customer generate per year?” It is built for subscription and contract-based businesses — B2B SaaS, managed services, recurring B2B relationships. ACV captures ongoing contract value normalized to a yearly amount, making it possible to compare multi-year deals or customers on different plans on an apples-to-apples basis (2).
The contrast in typical magnitude is the most useful frame. ACV deals are larger but fewer, common in enterprise B2B sales. AOV deals are smaller but more frequent, common in consumer or SMB transactional contexts. An e-commerce store might run on a $150 AOV. A B2B software firm might run on a $150,000 ACV. The median B2B SaaS ACV of ~$26K (3) dwarfs retail AOVs because B2B contracts involve sustained value delivery and ongoing relationships, not one-time transactions.
A small terminology trap worth flagging: AOV is sometimes referred to as “Annual Order Value” in B2B contexts, which can confuse things. To clarify: Average Order Value (the standard usage) is per order; Annual Order Value (less common) implies the total of a customer’s orders in a year — which is essentially ACV if those purchases are recurring. The cleanest way to keep them straight: if the metric is tied to individual purchase events, it is AOV; if it is tied to yearly contract or account value, it is ACV.
ACV is also commonly confused with TCV (Total Contract Value) — a closer cousin that is worth its own breakdown. We cover that next.
Annual Contract Value vs. Total Contract Value
If ACV vs ARR is the most-confused metric pair in B2B SaaS, ACV vs TCV is a close second — and the confusion costs companies real money. Misreporting TCV as ACV inflates “average deal size” by the contract length and creates expectations the team cannot deliver on. Misreporting ACV as TCV undersells the cash impact of a deal and can derail negotiations on multi-year terms.
Total Contract Value is the full dollar amount of a contract over its entire term, including one-time fees. ACV is the annualized recurring portion of that same contract. Both metrics describe the same deal — just from different angles.
ACV vs TCV at a glance
Aspect
ACV (Annual Contract Value)
TCV (Total Contract Value)
Time horizon
One year
Full contract term
Includes one-time fees?
No — recurring revenue only
Yes — setup, implementation, training, services
Formula
(TCV − one-time fees) / years in contract
Sum of all charges across the full term
What it tells you
Annual revenue impact of one contract
Total cash impact of one contract
Best for
Quota-setting, deal comparisons, segmentation
Cash-flow planning, deal-economics analysis, multi-year forecasting
Distorted by
Long contracts get under-counted in single-year views
Short contracts look smaller than they are
Used by
Sales leaders, RevOps, marketing
Finance, procurement, deal desk, legal
A worked example: where ACV and TCV diverge
Take a 3-year contract with the following structure:
- Annual subscription: $40,000/year
- One-time implementation fee: $10,000
- One-time training fee: $2,500
The math:
- TCV = ($40,000 × 3 years) + $10,000 + $2,500 = $132,500
- ACV = $40,000 (the recurring annual portion, with one-time fees excluded)
Same deal. Two very different numbers — and both are correct. A $72,000 three-year deal with a $9,000 setup has an ACV of $24,000 and an ARR impact of $24,000 in the first active year. ARR ignores the $9,000 because it is not recurring. ACV ignores it for the same reason. TCV is $81,000 because TCV includes the fee and spans three years. The framework is consistent: one-time fees only ever land in TCV. (10)
A common variant: companies that include one-time fees in ACV for the first year only, treating it as a hybrid metric. This is technically defensible if applied consistently and clearly disclosed, but it complicates year-over-year comparisons. The cleaner approach is to keep ACV strictly recurring and report one-time revenue separately.
When to use ACV versus TCV
Use ACV when comparing deals. A 1-year deal worth $50K and a 3-year deal worth $150K both have ACVs of $50K — they are equivalent in annual value despite the very different TCVs ($50K vs $150K). For sales reps comparing pipeline, for marketing teams attributing channel performance, and for territory planning, ACV is the metric that allows fair comparison.
Use TCV when sizing the cash and effort. A 3-year, $150K TCV deal locks in three times the revenue of a 1-year, $50K deal of the same ACV — that matters for cash-flow forecasting, contract negotiation, and the resource investment justified by the deal. Enterprise procurement teams almost always anchor on TCV because they are evaluating the total commitment, not the per-year slice.
Use both when negotiating multi-year terms. Multi-year contracts often come with discounts in exchange for longer commitments. Tracking the discount’s impact on ACV separately from its impact on TCV reveals whether the deal still makes sense — a 15% discount that lowers ACV from $50K to $42.5K may still be worth it if it locks in three years of TCV instead of one.
Why this matters for B2B revenue teams
The companies that get ACV vs TCV reporting right share three habits. They publish a one-page glossary so sales, marketing, and finance use the same definitions. They lock the formulas inside their CRM and BI tools so the metric cannot be calculated three different ways depending on who pulls the report. And they reconcile ACV-based bookings to the ARR roll-forward at quarter close, which surfaces inconsistencies before they reach the board. Without that discipline, finance and sales end up presenting different “truths,” and the conversation devolves into a definitional argument instead of a strategic one. (10)
For revenue leaders who run outbound campaigns targeting enterprise prospects, the practical implication is straightforward: report deal pipeline in ACV terms when discussing with sales and marketing, and report it in TCV terms when discussing with finance and the board. Same deals, different audiences, different metric.
ACV Benchmarks by Company Segment
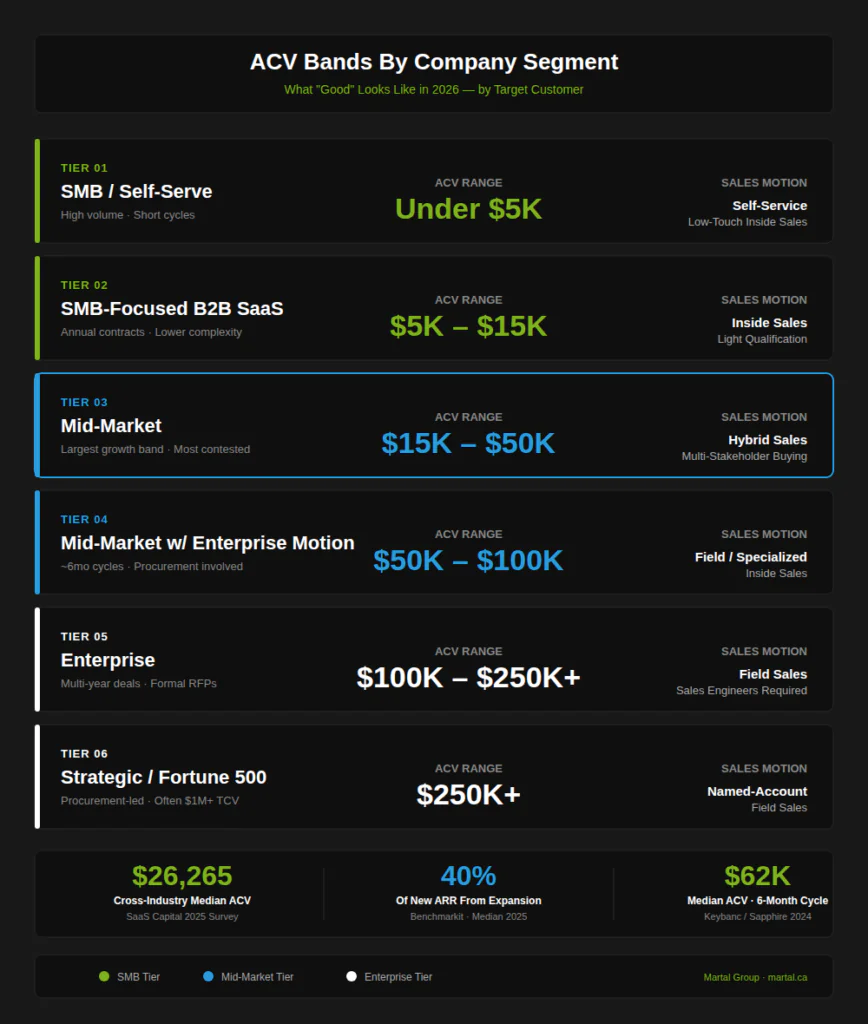
The first question most revenue leaders ask after calculating ACV is the obvious one: is this number good? The honest answer is it depends — but the more useful answer is that ACV benchmarks fall into reasonably stable bands depending on your target customer segment. According to OpenView Partners’ SaaS benchmarking research, median ACV varies dramatically by market segment: $10K–$25K for mid-market SaaS companies, $50K–$100K for enterprise-focused vendors, and under $5K for SMB-targeted products. (9)
Several other sources align on roughly the same shape, with slight variation depending on the dataset:
- Upollo’s SaaS Glossary places average annual contract values at $5,000–$15,000 for SMB-focused SaaS, $15,000–$50,000 for mid-market, and $50,000–$250,000+ for enterprise-level SaaS companies. (8)
- The 2024 Keybanc Capital Markets and Sapphire Ventures SaaS survey found that for SaaS companies with a six-month sales cycle, the median ACV is $62,000 — a useful proxy for “mid-market with enterprise-style sales cycles.” (11)
- SaaS Capital’s survey of 1,000+ private B2B SaaS companies puts the cross-segment median at $26,265, which sits at the lower end of mid-market when broken out by company size. (3)
ACV bands by segment
Segment
Typical ACV Range
Sales Motion
Notes
SMB / Self-serve
Under $5,000
Self-service or low-touch inside sales
High volume, short sales cycles, often month-to-month
SMB-focused B2B SaaS
$5,000–$15,000
Inside sales with light qualification
Annual contracts common, lower deal complexity
Mid-market
$15,000–$50,000
Inside or hybrid sales with multi-stakeholder buying
The largest growth band — and the most contested
Mid-market with enterprise motion
$50,000–$100,000
Field or specialized inside sales
Longer sales cycles (~6 months), procurement involvement
Enterprise
$100,000–$250,000+
Field sales with technical resources, sales engineers
Multi-year deals, formal RFPs, security and legal review
Strategic / Fortune 500
$250,000+
Named-account field sales
Procurement-led, often $1M+ TCV across 3-year terms
What the benchmarks actually mean
The most important framing point: higher ACV is not automatically better. Larger ACV solutions consistently exhibit higher costs to acquire a customer, which need to be evaluated alongside Gross Revenue Retention, Net Revenue Retention, Customer Lifetime Value to CAC ratio, and growth rate to fully understand the long-term impact on revenue, cash generation, and enterprise value. A high-ACV business with weak retention can underperform a low-ACV business with disciplined renewal motion. (12)
A useful counterweight comes from the same SaaS Capital dataset that gives us the headline ACV numbers. Continuing a pattern observed over multiple years, overall average annual contract value (ACV) levels do not appear to have an overall correlation with growth rate. A SaaS company selling $5K deals can grow just as fast as one selling $100K contracts. What matters more is retention efficiency and the ability to expand the existing customer base. Slack famously built a multi-billion-dollar business on relatively low ACVs because it nailed retention and adoption velocity. Workday built one on six-figure ACVs because it nailed deep enterprise integration and switching costs. Both work. They just demand very different go-to-market motions. (3)
The corollary: when teams chase higher ACV without first solving for retention and qualification, they often end up with longer sales cycles, higher CAC, weaker close rates, and no measurable growth lift. Moving up-market is a real strategy, but it is a multi-quarter investment — not a quick fix for soft pipeline.
How retention and ACV interact
There is one cross-metric pattern that does hold consistently: higher-ACV businesses tend to retain better. SaaS Capital’s results show companies with NRR below 90% report a median ACV of $21,017, while companies with NRR above 120% report ACVs above $40,000 — with a brief disruption between 110%–120% where ACV drops to $28,853 before rising again. This relationship runs in both directions: enterprise customers making larger annual commitments tend to be more deeply integrated and harder to displace, and products that lend themselves to higher-ACV pricing usually also lend themselves to expansion (more seats, more modules, more usage). (3)
The practical implication for a revenue leader: if your current ACV is $30K and you want to move it toward $50K, the levers are not just “find bigger customers.” They are also deeper integration into customer workflows, broader product surface area, and a renewal motion that systematically expands accounts year over year. The companies that grow ACV durably do all three at once.
How ACV benchmarks shape outbound strategy
For revenue leaders running outbound lead generation or appointment setting, benchmark bands have direct implications for campaign design. Targeting enterprise-band accounts ($100K+ ACV) requires multi-stakeholder messaging, sales engineering involvement, and sales cycles measured in months — not weeks. Targeting mid-market ($15K–$50K ACV) supports faster cycles and lower-touch follow-up but rewards volume and consistent activity. Trying to run an enterprise motion against mid-market ACV economics — or vice versa — is one of the most common mistakes we see in pipeline programs.
We work with B2B clients across both motions and the difference is clear. In an engagement with HALO Recognition, a global HR services firm, our team generated over $10M in new business opportunities by sustaining enterprise-level outreach across a multi-stakeholder buying process — exactly the kind of motion that supports six-figure ACV deals. For a Fintech FP&A software client based in Germany, the same outbound infrastructure produced 30,000 prospects per month and 21 monthly meetings — a higher-velocity motion better suited to mid-market ACV economics. Different ACV bands. Different campaigns. Same underlying playbook, calibrated to the deal economics.
ACV and Revenue Planning: Using Annual Contract Value to Drive Growth
Companies with Net Revenue Retention (NRR) above 120% had ACVs exceeding $40K, while those with NRR below 90% had ACVs under $21K.
Reference Source: SaaS Capital
Bold revenue targets and tight sales budgets force a single discipline: you cannot afford to chase every deal. ACV is the lens that turns revenue ambition into a pipeline plan, helping you allocate sales capacity where it yields the most return. Planning around ACV forces revenue leaders to answer the questions that matter — how many deals do we actually need next year, what mix of deal sizes do we pursue, and where does enterprise focus pay off versus mid-market volume?
Start with forecasting math. If your annual goal is $10 million in new ARR and your average ACV is $100K, you need 100 new customers. Move ACV to $200K through up-market targeting and packaging changes, and you need 50. Same revenue. Half the deal count. This is why so many 2026 sales plans now treat ACV as a deliberate lever, not a passive output. Research from SaaS Capital’s survey shows that companies with high ACV growth tended to grow faster than those with stagnant deal sizes — though, as noted in the Benchmarks section above, the relationship is conditional on retention efficiency. (3)
ACV also sharpens forecasting accuracy. Traditional pipeline reviews count deals and apply an average win rate. ACV-weighted reviews weigh each deal by its annual revenue contribution, so two $250K-ACV deals at the proposal stage carry more strategic weight than ten $25K-ACV deals at the same stage. The shift sounds obvious but most CRM dashboards still default to deal counts. Switching to ACV-weighted views typically changes which deals get executive attention and where reps spend their final two weeks of the quarter.
The same logic applies to capacity planning. If each rep historically closes $X in ACV per quarter, you can model headcount against revenue goals with real precision rather than ratio-based guesswork. ACV is also tied directly to retention. For B2B companies with ACV above $6K, top-quartile NRR reaches 109.3%, and SaaS Capital’s data shows that moving NRR from the 90–100% band to 100–110% improves growth by roughly 5 percentage points. Larger annual commitments correlate with deeper integration, higher switching costs, and more durable revenue. Smaller annual commitments correlate with faster churn and tighter unit economics. Both can work — but they demand different account management investment.
Five ways to leverage ACV in revenue planning
The best revenue plans use ACV as a structural input across multiple decisions, not just a forecasting metric:
- Set tiered goals by ACV segment. Rather than a one-size-fits-all quota, assign different targets for enterprise (high ACV) versus SMB (lower ACV) reps. A balanced plan might call for 5 enterprise wins at $200K+ ACV and 20 mid-market wins at $50K ACV — focused on both whale-hunting and consistent volume.
- Align sales incentives with ACV growth. Structure commissions to reward higher-ACV deals. Some companies pay accelerated rates above a defined ACV threshold, motivating reps to qualify into bigger accounts rather than padding quota with smaller, faster wins.
- Plan account expansion explicitly. Set targets for expansion ACV, not just new-logo ACV. Expansion ARR now accounts for 40% of total new ARR at the median — meaning the companies leaving expansion to chance are leaving nearly half their growth on the table. (13)
- Define ICP fit by ACV potential. When defining your Ideal Customer Profile, include the ACV a “good-fit” account could realistically support. Direct your outbound lead generation, prospecting, LinkedIn outreach, and cold calling toward those high-ACV potential accounts. This is where partnering with a team built around outbound matters — campaigns can be deliberately tuned to engage accounts that match your ACV target rather than whoever responds first.
- Use ACV in territory planning. Distribute accounts so each rep’s territory carries a comparable total ACV potential. This makes quotas equitable and reduces the perpetual sales-leadership debate about “fair territories.”
What this looks like in practice
In an engagement with Berger-Levrault, a France-based HR and ERP software company expanding into the US and Canadian markets, the targeting math worked exactly the way ACV planning suggests it should. The engagement reached 1,800 prospects across mid-market and enterprise targets, generated 85 MQLs and 12 SQLs per month, and ultimately produced two major deals that on their own justified the entire campaign investment. That is the ACV thesis applied: a smaller number of well-fit, high-value contracts can outperform a larger number of low-ACV deals — provided the targeting and qualification are calibrated to the segment.
For mid-market motions, the math runs differently but the principle holds. A B2B SaaS client in the CMMS/EAM software category, working in mid-market verticals across healthcare, transportation, manufacturing, and utilities, generated 1,708 leads, 936 MQLs, 185 SQLs, and 144 booked meetings over 26 months — exactly the velocity profile a mid-market ACV band ($15K–$50K) supports. Higher meeting volume, faster cycles, and a steadier pipeline rhythm than enterprise economics could justify.
Both engagements illustrate the same point: ACV is not just a number to track. It is the planning input that should shape segmentation, capacity, channel selection, and quota design.
Annual Contract Value Calculation: Formula and Tools
A company earning $2,000,000 in recurring contract revenue from 500 customers would have an average ACV of $4,000.
Reference Source: Zuora
The math is straightforward. The discipline is in applying it consistently. Most ACV reporting issues are not formula errors — they are definitional inconsistencies between sales, finance, and marketing about what counts as recurring revenue and how to handle multi-year deals.
The annual contract value formula
For a single contract, the basic ACV formula is:
ACV = (Total Contract Value − One-time fees) / Number of years in the contract
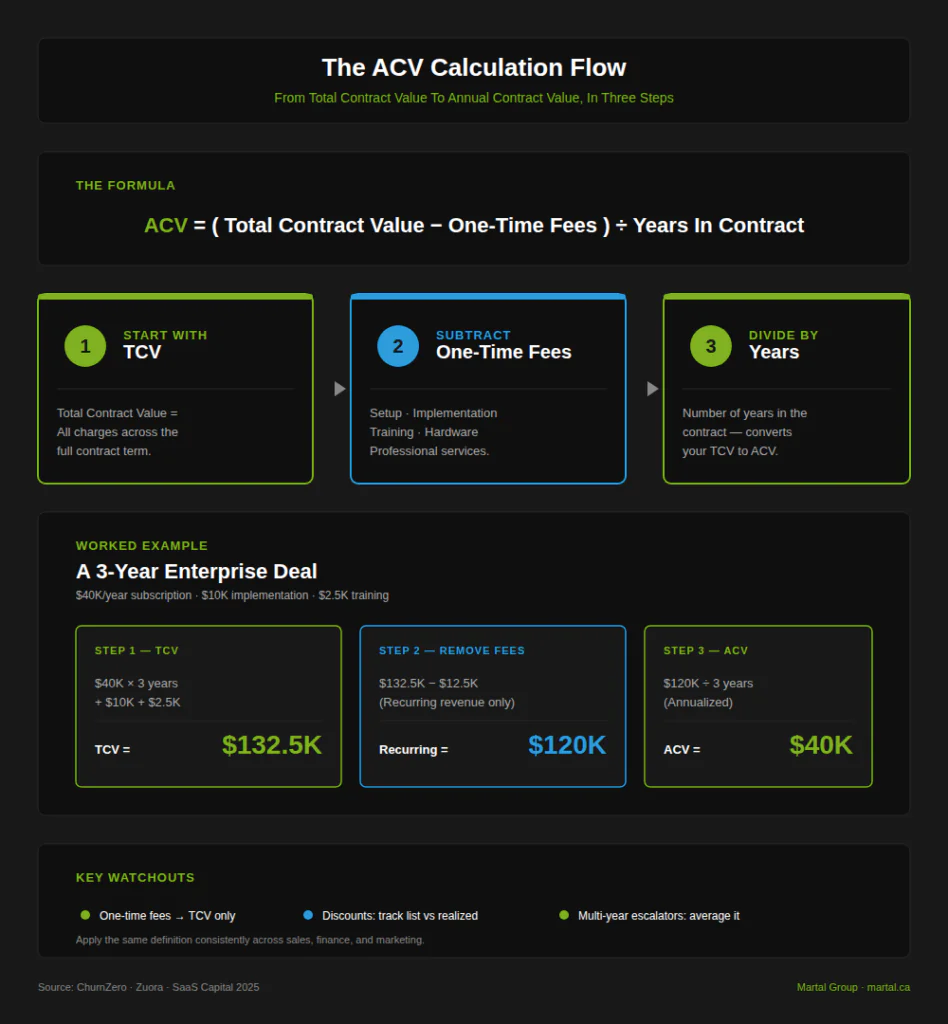
A customer signs a $120,000 contract over 3 years with no setup fees. ACV = $120,000 / 3 = $40,000 per year. For a 1-year contract, ACV is simply the recurring contract value for that year. For monthly subscriptions, multiply MRR by 12 to annualize.
The complication arrives when contracts are not uniform. Consider two customers:
- Customer A: $100,000 contract over 5 years
- Customer B: $100,000 contract over 2 years
ACV varies year by year:
- Year 1: $20,000 (A’s annual portion) + $50,000 (B’s annual portion) = $70,000 (4)
- Year 2: Same $70,000 (both still active)
- Year 3: $20,000 (only A remains) (4)
- Years 4–5: $20,000 each
This is why most companies report an Average ACV across all customers in a given period:
Average ACV = (Total recurring revenue across all contracts − one-time fees) / Number of customers (1)
If 500 customers generated $2,000,000 in annual contract revenue in 2024, your average ACV is $4,000(4). One-time charges — implementation fees, hardware, training — should sit outside the calculation if you want a clean recurring-revenue picture (1).
Annual contract value calculator tools
Several SaaS analytics and finance sites publish ACV calculators that handle the math automatically — Wall Street Prep (7) and PayPro Global both offer them. For most B2B teams, the math is simple enough that a basic spreadsheet does the work. The harder part is upstream — defining your inputs clearly:
- Decide whether ACV will include only subscription fees, or also annualized service fees
- Decide whether you’ll separate “new business ACV” from “renewal ACV” and “expansion ACV”
- Decide whether you’ll calculate ACV on list price (cleaner volume metric) or on actual discounted revenue (more realistic) (1)
- Decide how to handle mid-contract upgrades and downgrades — they will change ACV mid-year if you don’t lock to a snapshot date
The single most important tool decision is not which calculator you use. It is applying the same definition consistently across every report. Subscription-management platforms (Zuora, Chargebee, and similar) automate the calculation once your input rules are set, but they will faithfully report whatever definitions you feed them. If sales is using one definition and finance is using another, the platform will not save you.
Common scenarios that affect ACV
A few scenarios consistently change the calculation:
- A customer upgrades mid-year → that year’s ACV contribution increases
- A renewal at a higher price → ACV rises in the renewal year
- A down-sell or contraction → ACV falls
- A multi-year prepaid deal with annual escalators → calculate the average annual value across all contract years, not just year one
For pipeline planning, the most useful application is a simple model: list target accounts, estimate the realistic ACV each one could support, and prioritize outreach accordingly. This is how high-performing outbound lead generation teams allocate effort — by ACV potential, not by account count.
Common ACV Mistakes: Where B2B Teams Get It Wrong
ACV mistakes are almost never math errors. They are policy errors — different teams using different definitions, then presenting their results as if they were the same metric. The root cause is almost never math; teams disagree on what counts, when it counts, and whether one-time fees belong in the number. The formulas are simple — the organizational discipline to apply them consistently is the hard part. (13)
These are the five mistakes that show up most frequently in board decks, sales reports, and forecasts — drawn from the questions B2B revenue leaders actually ask on Reddit, Quora, and LinkedIn when they realize their numbers do not reconcile.
Mistake 1: Including one-time fees in ACV (or in ARR)
This is the most common error and the most damaging. Setup costs, implementation fees, training charges, professional services, hardware — none of them belong in ACV, and none of them belong in ARR. They belong in TCV. One of the biggest and most frequent blunders is letting one-time fees creep into your ARR calculation. ARR is sacred ground; it should only include predictable, recurring revenue. When you start adding in setup fees, implementation costs, or one-off consulting gigs, you’re just fooling yourself. (6)
Why it happens: A new customer with a $40K annual subscription and a $10K implementation fee feels like a $50K customer in year one. The deal team books it that way; finance reports it that way; the next quarter’s forecast assumes that pattern continues — and the gap between what was reported and what’s actually recurring catches up two or three quarters later.
Quick fix: Lock the recurring/non-recurring split inside your CRM and billing tool. Setup fees flow into TCV only. ACV stays clean. The first invoice may be larger than the ACV, and that’s fine — finance reports the difference as services revenue, not recurring.
Mistake 2: Confusing average ACV with total ACV
A team closes 10 deals at $30K ACV each. Total contracted ACV is $300K. Average ACV is $30K. Both are useful — but they answer different questions, and confusing them in a board report is one of the fastest ways to lose credibility.
Why it matters: Counting ACV as if it were total revenue is a common mistake. ACV is the per-customer measure; ARR is the aggregate. Using them interchangeably distorts both numbers. The same risk applies inside ACV itself — “average ACV trended up this quarter” is a very different statement from “total contracted ACV trended up this quarter,” especially if customer count moved in the opposite direction. (15)
Quick fix: When reporting ACV, always specify whether you mean average ACV per customer or total contracted ACV in the period. Two phrases. Use them consistently.
Mistake 3: Treating gross ACV as net ACV
Real human-driven question pattern: “How do you calculate ACV when you have customers churning and downgrading mid-year?”
This question shows up constantly in r/SaaS and Quora threads, and the answer reveals one of the trickiest ACV pitfalls. Gross ACV is the total annualized value of all new and expansion contracts. Net ACV subtracts churn and contractions. A company can show strong gross ACV growth while net ACV is flat or negative — meaning new sales are being eaten by retention losses.
Why it matters: Gross ACV by itself paints an optimistic picture. If you only report gross, you can miss a retention crisis until it’s already affected ARR.
Quick fix: Track both. Report gross ACV alongside churn and contraction in the same period. Better still, report Net New ACV as the headline metric for any new-business motion.
Mistake 4: Ignoring discounting impact on ACV
SalesHive reports that SaaS companies lose an average of 18% of their ACV to discounts. That’s a significant revenue leak that disciplined, value-based selling can close. Tracking discounted ACV versus list ACV separately gives revenue operations teams a cleaner picture of pricing health. (14)
Why it matters: If reps are systematically discounting to close, your reported ACV reflects discounted reality — but your pricing benchmarks, packaging decisions, and quota-setting may still be calibrated to list price. The gap silently erodes margin.
Quick fix: Track list ACV and realized ACV as two separate metrics. The delta is your discount leakage. Beyond a certain percentage, the issue is no longer pricing — it’s qualification or sales enablement.
Mistake 5: Inferring growth from ACV alone
Why this mistake happens: ACV is easy to average and compare. Why it is harmful: ACV can rise while ARR stalls due to churn. Quick fix: pair ACV with ARR trends, show ACV bands next to ARR roll-forwards, and highlight churn and contraction in the same period. (10)
Why it matters: Rising ACV looks like good news. But if larger new deals are masking accelerating churn in the existing base, ACV is telling a different story than ARR. As we covered in the Benchmarks section, SaaS Capital’s data shows that ACV alone does not correlate with growth rate — what matters more is retention efficiency and expansion.
Quick fix: Never present ACV as a standalone growth indicator. Always pair it with ARR, NRR, and churn. The triangle tells the truth.
A few real questions worth answering directly
Three questions consistently come up in B2B SaaS founder communities, sales-leader groups, and CRO discussions on LinkedIn:
- “Should I include implementation fees in my ACV if my contract requires them?” No. Include them in TCV. ACV reflects what renews; implementation fees do not renew.
- “How do I calculate ACV for a multi-year deal with annual price escalators?” Calculate the average annual value across all contract years. A $40K/year deal in year one stepping to $44K and $48.4K in years two and three has an ACV of $44,133 — the simple average. Do not use year one only.
“Why does my ACV look low compared to what investors expect?” Often it’s segment fit, not a problem. SMB-focused SaaS routinely runs $5K–$15K ACV by design, and the highest-growth companies in that band win on volume and retention, not deal size. The right benchmark is your segment median, not the cross-industry average. (3)
Leveraging ACV in 2026 B2B Sales Strategy (and How Martal Group Can Help)
Expansion ARR now accounts for 40% of total new ARR at the median. The companies treating expansion as an afterthought are leaving close to half their growth on the table.
Reference Source: Prospeo
2026 is shaping up to be a year of leaner, sharper B2B sales strategies — and ACV-centric planning sits at the center of it. With economic pressure on every revenue line and intensified C-suite scrutiny on ROI, sales leaders are being asked to do more with less. That means quality over quantity: pursuing the leads, channels, and accounts that maximize revenue yield per effort.
Here is how to put ACV at the operational center of your strategy — and where Martal’s outsourced sales and outbound teams plug into the work.
- Target high-ACV segments deliberately. Use your customer data to identify the industries and company profiles that consistently produce larger contracts. Fintech, regulated healthcare, and enterprise manufacturing tend to spend more on B2B software because their stakes are higher and their workflows are more entrenched — making them natural high-ACV segments. Account-Based Selling has surged in 2026 for exactly this reason: fewer accounts, deeper engagement, larger deals. Martal supports this through targeted outbound campaigns — cold email, cold calling, LinkedIn outreach — calibrated specifically to high-ACV ICPs. By outsourcing the top-of-funnel research and engagement work, your AEs spend their time nurturing and closing rather than prospecting.
- Personalize for multi-stakeholder buying. A $5K ACV deal closes via a quick demo. A $100K ACV deal involves four to seven stakeholders and a procurement review. Messaging that works at one ACV band rarely transfers to the other. High-ACV customers expect coordinated, multi-touch sequences — an email referencing their industry challenges, a LinkedIn touch building thought leadership, a phone call with technical context, a proof-of-value conversation tied to a relevant case study. In an engagement with Clickworker, an AI training data marketplace based in the US and Germany, Martal’s nine-year partnership produced over $4.5M in recurring revenue, three Fortune 500 logos and three Fortune 10 logos, and a 500% ROI on the program. That’s the multi-stakeholder, high-ACV motion in practice — sustained, coordinated outreach into the kinds of accounts where six- and seven-figure annual contracts get signed.
- Make expansion ACV a planning discipline. Increasing ACV is not just a new-logo problem — it’s an account-management problem. Identify expansion paths early in customer success and run dedicated outreach against them. Improving NRR from the 90–100% range to 100–110% improves median growth rates by 5 percentage points — a meaningful lift that compounds year over year. Set explicit targets for expansion ACV alongside new-logo ACV. If your in-house team doesn’t have bandwidth to run dedicated upsell campaigns, our sales support and lead generation and appointment setting for account managers fills that gap, scheduling discovery and renewal conversations with existing accounts so expansion opportunities don’t quietly slip through the cracks.
- Use data to optimize ACV by source. Track ACV by acquisition channel: do leads from webinars yield higher ACV than leads from trade shows? Do outbound sales deals carry higher ACV than inbound leads? In our experience, outbound campaigns can be deliberately tuned to engage high-ACV accounts, while inbound tends to attract a broader and more variable mix. For SaaS companies with a six-month sales cycle, the median ACV reaches $62,000 — and those longer-cycle deals are disproportionately outbound-sourced. The 2026 layer worth adding: AI-driven intent signals and predictive scoring now help teams identify high-ACV-potential accounts earlier in the cycle, so outbound prospecting effort lands on the accounts most likely to convert at your target ACV. (11)
- Align marketing and sales on ACV quality. MQLs should be evaluated on potential value, not just volume. Fifty leads that could each become $100K deals are worth more than five hundred leads that are $5K each. Marketing should be producing content, events, and campaigns that attract the C-level personas matching your high-ACV profile — whitepapers for enterprise buyers, executive roundtables, account-specific outreach. When sales and marketing both treat ACV as a shared KPI, the pipeline becomes smaller in count but richer in dollars. The classic friction — sales saying “marketing leads are too small,” marketing saying “sales only cherry-picks big accounts” — collapses when ACV is the agreed-upon shared metric.
- Match quotas and resourcing to ACV bands. Higher-ACV deals carry longer sales cycles and demand more support — sales engineers, custom decks, executive sponsors, on-site meetings. The economics still work if structured properly. Give your enterprise rep a $2M quota with a $200K ACV target (≈10 wins). Give your mid-market rep a $500K quota with $25K ACV deals (20 wins). The resourcing should match: enterprise reps need technical bench depth, mid-market reps need volume support and qualified meeting flow. Martal’s role for many clients is exactly this — handling the prospecting and qualification heavy-lifting that frees senior closers to focus on the accounts and conversations where their time produces the most revenue.
The thread running through all six is the same: leveraging ACV means always weighing the value side of the equation alongside volume. Will this lead, channel, or campaign help us land or expand a high-value customer? In 2026‘s tighter operating environment, that is the question that separates the teams hitting their numbers from the teams chasing them.
If reaching those high-ACV goals feels daunting, partnering with experts can make the difference. Martal’s onshore sales team, paired with our omnichannel infrastructure across cold email, cold calling, and LinkedIn outreach, generates sales-ready leads tied to real contract value potential. Many B2B companies treat us as an extension of their team — our experts handle top-of-funnel outreach and nurture prospects with relevant content, while your team focuses on the conversations that close. That division of labor is what makes ACV growth durable rather than episodic.If you’re looking to maximize ACV and scale your B2B sales in 2026, our sales outsourcing and lead generation services are built to fill your pipeline with the kinds of prospects that justify the effort and convert into long-term contracts.
Conclusion: Winning with ACV in 2026
ACV is more than a metric. It is the lens that translates revenue ambition into operational decisions — which deals to qualify, which accounts to pursue, where to allocate sales capacity, and how to structure the next pipeline conversation. The B2B teams that treat ACV as a strategic input — not just a reporting output — are the ones consistently hitting their numbers in 2026‘s tighter operating environment.
The takeaways are practical. Define ACV cleanly and apply the definition consistently across sales, finance, and marketing. Pair it with ARR, NRR, and TCV instead of using it in isolation. Track gross and net ACV, and watch the discount delta. Set quota structures and territory plans that reflect ACV bands rather than uniform deal counts. And build expansion ACV into the plan from day one — that is where 40% of new ARR is now coming from.
The harder part is execution. The companies winning at high-ACV motions in 2026 share three operational habits: they target ICPs by ACV potential, they run predictable pipeline through coordinated omnichannel outreach, and they free their senior closers from prospecting work so they can focus on closing sales deals that move the revenue needle. Across the engagements where we’ve delivered the strongest results — including multi-year partnerships producing seven-figure recurring revenue and Fortune 500 wins — that combination is the through-line.
If your team is building toward higher-ACV deals in 2026, Martal’s sales outsourcing and lead generation services can fill your pipeline with the prospects worth pursuing. Our onshore sales team handles cold email, cold calling, and LinkedIn outreach as a coordinated omnichannel motion — calibrated to your ACV target — so your closers can spend their hours where the revenue is. Many B2B clients treat us as a sales partner, and the results compound over time as the program optimizes against real campaign data.
Get in touch for a consultation, and we will walk through how to translate your ACV strategy into the kind of pipeline that supports it.
References
- ChurnZero
- Coldlytics
- SaaS Capital
- Zuora
- Opensend
- Lowchurn
- WallStreet Prep
- RevTek Capital
- Saber
- Orb
- Golimelight
- Benchmarkit
- Prospeo
- Apollo
- Mercury
FAQs: Annual Contract Value
What is annual contract value (ACV) in simple terms?
Annual Contract Value (ACV) is the average annual revenue you earn from a single customer contract, normalized to a 12-month basis. If a customer signs a 3-year deal worth $90,000, the ACV is $30,000 per year. ACV typically excludes one-time fees like setup, implementation, or training charges, focusing only on the recurring or renewable portion of the contract. The metric exists so that contracts of different lengths can be compared on equal footing — without it, a 5-year deal looks five times bigger than a 1-year deal of the same annual value.
How do you calculate ACV, and what’s the difference between ACV and ARR?
The formula is ACV = (Total Contract Value − one-time fees) / number of years in the contract. ACV measures revenue per customer per year. ARR (Annual Recurring Revenue) measures the total recurring revenue a business earns from all customers annually. ACV is granular and per-contract; ARR is aggregate and company-wide. Close 10 deals at $50K ACV and you’ve added approximately $500K to ARR. The two metrics nest together, but using one when you need the other will distort the answer — ARR is for board decks and investor reporting, ACV is for sales performance and pipeline planning.
Should I include implementation fees in my ACV calculation?
No — implementation fees, setup costs, training, and professional services should sit in TCV (Total Contract Value), not ACV. ACV is meant to reflect what renews; one-time fees do not renew. Including them inflates first-year ACV and creates a forecasting trap that catches up with the team within two or three quarters when renewals come in lower than the original “ACV.” If you need to track first-year revenue including services, report it as a separate metric (sometimes called “first-year billings”) rather than blending it into your ACV reporting.
What is a good ACV for a B2B SaaS company?
It depends on your segment. SMB-focused SaaS typically runs $5K–$15K ACV. Mid-market sits around $15K–$50K. Enterprise-focused SaaS runs $50K–$250K+. The cross-industry median for private B2B SaaS in the SaaS Capital survey was $26,265. But the more important framing is that higher ACV is not automatically better. SaaS Capital’s data shows that ACV alone does not correlate with growth rate — a company selling $5K deals can grow as fast as one selling $100K contracts, provided retention and expansion efficiency are strong. The right benchmark for your business is your segment median, not the cross-industry average.
How can we increase our ACV, and why does it matter for sales planning?
ACV grows through upsells, cross-sells, multi-year commitments, larger initial contract sizes, tier upgrades, and deeper integration into customer workflows. It matters for sales planning because higher ACV means fewer deals are needed to hit revenue goals — a $10M new ARR target with $100K ACV needs 100 new customers, but only 50 if ACV moves to $200K. ACV growth also typically correlates with stronger retention, since customers making larger annual commitments tend to be more deeply integrated and harder to displace. Expansion ACV — growing existing accounts year over year — is now responsible for around 40% of new ARR at the median, making it one of the most important levers in any 2026 revenue plan.
How do I calculate ACV for a multi-year deal with annual price escalators?
Calculate the average annual value across all contract years. A common example: a 3-year deal that starts at $40,000/year and escalates 10% annually (to $44,000 in year two and $48,400 in year three) has a TCV of $132,400 and an ACV of $44,133 — the simple average across the three years. Using year one only ($40,000) understates the deal. Using year three only ($48,400) overstates it. The average across the contract term is the most defensible representation for forecasting, quota tracking, and renewal planning. If escalators are tied to usage rather than scheduled increases, calculate ACV based on the contracted minimum and report any usage-driven upside separately.