Strategic B2B Reporting in 2025: From Data to Deals
Major Takeaways: B2B Reporting
Why does strategic B2B reporting matter in 2025?
- Because 65% of B2B sales teams are shifting to data-driven decisions, reporting is now a strategic function—not just a retrospective task.
What should a strong B2B outbound reporting framework include?
- A strategic reporting system starts with clearly defined KPIs, integrated tech tools, ownership, and a cadence that aligns with revenue goals.
Which outbound metrics are critical to track?
- Email reply rate, call connect rate, lead-to-opportunity conversion, pipeline value, and cost per lead all provide actionable insights across the funnel.
How can reports uncover what’s working—and what’s not?
- By segmenting data by rep, channel, industry, and sequence, you can pinpoint bottlenecks, refine targeting, and optimize messaging using real-world trends.
How should B2B teams act on reporting insights?
- Use the data to coach reps, prioritize high-converting ICPs, revise outreach cadences, and align resources toward proven outbound tactics.
How is AI changing B2B outbound reporting?
- AI enhances reporting with predictive scoring, real-time recommendations, and anomaly detection—helping teams act faster and smarter on every data point.
What role does visual reporting play in strategic decisions?
- Dashboards, funnel charts, and real-time alerts make reporting digestible, encouraging action from SDRs to CMOs by turning data into clear narratives.
Introduction
Is your outbound data actually helping you close more deals, or is it just piling up in spreadsheets? In 2025, data-driven strategy is no longer optional – it’s the dividing line between teams that consistently hit their targets and those that fall behind.
In fact, by 2026, 65% of B2B sales organizations will have shifted from gut instinct to data-driven decision-making (1). The pressure is on: up to 73% of B2B sales reps missed quota in 2024 (2), a clear sign that old-school outbound approaches need a serious upgrade.
And while outbound selling is still vital, success comes from making it smarter with better reporting. Data is essential for crafting effective marketing strategies and connecting with target audiences.
From Data to Deals isn’t just a catchy phrase; it’s a mandate. 30% of marketers report that data guides them in identifying their most effective tactics (3).
Modern B2B sales leaders are expected to turn the flood of outbound activity data (emails sent, calls made, LinkedIn touches, etc.) into actionable insights that drive revenue.
In this comprehensive guide, we’ll walk through how to establish strategic B2B reporting for your outbound efforts, so you can pinpoint what’s working, fix what’s not, and continually optimize your approach. We’ll cover how to build a reporting framework, which key metrics to track, and how to leverage those reports to transform cold outreach data into closed deals. Along the way, we’ll highlight the latest trends (like AI-driven analytics) and proven best practices that top-performing teams use to stay ahead.
By the end, you’ll understand how strategic B2B outbound reporting in 2025 can become your competitive advantage – helping you move from raw data to real deals, faster. Let’s dive in.
Why Strategic B2B Reporting Matters in 2025
65% of B2B sales organizations will shift from intuition to data-driven decision-making by 2026.
Reference Source: Gartner
In B2B sales, reporting isn’t just record-keeping – it’s strategic steering. A robust reporting practice shines a light on where your outbound process is succeeding and where it’s stalling. With buyer behavior evolving and markets tightening, having the right data at your fingertips is critical. Here’s why strategic B2B reporting matters more than ever in 2025:
- Data beats intuition: B2B teams today have access to unprecedented volumes of data on prospect engagement. Strategic reporting turns this raw data into insights. Organizations that embrace data-driven outbound decisions are leaving competitors in the dust – by 2026, those that pivot to data-driven sales will outpace gut-driven peers by 65% (4) in performance. In an era where every email open, call connection, and LinkedIn reply can be tracked, relying on instinct alone is a liability.
- Identify issues before they become failures: Effective reporting flags problems early. For example, if your lead-to-opportunity conversion rate is dropping or your email response rates tanked this quarter, a good report will make that trend obvious. Strategic reporting gives you the foresight to course-correct mid-quarter instead of realizing at Q4 that your pipeline was off-track.
- Align the team on what matters: When done right, B2B reporting focuses everyone on common goals and objective numbers. We want our SDRs, sales executives, and marketers all looking at the same scoreboard. If the data shows that personalized emails have 2x the reply rate of generic blasts, we can double down on personalization across the team. If outbound call connect rates are low but 49% of buyers actually prefer being contacted by phone (4), it signals an opportunity to refine our calling approach rather than abandon calls. In short, strategic reports turn “opinions” into facts everyone can rally around.
- Drive continuous improvement: Perhaps most importantly, strategic reporting creates a culture of continuous improvement. We measure, therefore we can improve. Each month or quarter, your reports should inform a retro: What worked? What didn’t? Maybe you discover that 82% of prospects will book a meeting if outreach is timely and relevant (11) – a cue to invest in better targeting and sales cadences. Or you see that a specific industry segment responded at half the rate of others, prompting a tweak in your Ideal Customer Profile (ICP) or messaging for that vertical. Without these data-driven feedback loops, teams operate in the dark.
In 2025, being “data-driven” isn’t a buzzword; it’s practically a survival skill in B2B outbound. Strategic reporting is how you put that skill into practice. It’s the difference between throwing darts blindfolded versus aiming with a laser scope. Next, we’ll look at how to build a reporting framework that ensures you’re capturing the right data and turning it into actionable strategy.
Building a Strategic B2B Reporting Framework for Outbound Sales
82% of buyers will meet with a salesperson who proactively reaches out with relevant insights.
Reference Source: RAIN Group
Having a mountain of data won’t help if it’s not structured into a usable framework. To make reporting truly strategic, we need a plan. Building a B2B outbound reporting framework involves defining what to track, how to track it, and how to interpret it. Here’s how to set up a solid foundation:
1. Define Clear Objectives (Start with the “Why”) – Begin with the end in mind. Ask, what decisions or improvements should our reports enable? For outbound sales, common objectives include increasing qualified leads, improving conversion rates, reducing sales cycle time, and lowering customer acquisition cost.
When you clarify the goals, you ensure your reports zero in on metrics that matter (we’re not measuring vanity metrics for vanity’s sake). For instance, if your goal is to boost outbound deal volume by 20%, you’ll want to report on early-funnel indicators (like outreach activity and response rates) as well as later-stage metrics (like opportunities created and win rates).
2. Identify Key Metrics & KPIs – Once objectives are set, decide on the Key Performance Indicators (KPIs) and metrics that directly reflect progress toward those goals.
We’ll dive deeper into specific metrics in the next section, but as a preview: consider metrics across the outbound funnel. How many calls/emails go out? How many prospects engage? How many meetings are booked? How many deals close?
Each stage needs at least one metric in your framework. For example, to gauge outreach effectiveness, track email open and reply rates; to measure pipeline health, track SQLs (sales-qualified leads) and pipeline value; to assess efficiency, track metrics like cost per lead (CPL) and sales cycle length. Choose metrics that are SMART – Specific, Measurable, Actionable, Relevant, Time-bound – so your reporting drives real action.
3. Leverage the Right Tools – Strategic reporting requires pulling data from multiple sources and making sense of it in one place. That’s hard to do manually. A modern tech stack is your friend here.
Customer Relationship Management (CRM) systems (like Salesforce, HubSpot) are the backbone, capturing interactions and pipeline data. On top of that, consider specialized tools:
- Sales engagement platforms which often have built-in analytics for sequences, email performance, and call outcomes.
- Business intelligence dashboards (Tableau, Power BI, or even Google Data Studio) to unify data from different sources and visualize trends. A well-configured dashboard can automatically update your key charts daily – e.g., a live graph of meetings booked vs. target, or a map of current pipeline by stage. We use such dashboards to get real-time insight into our campaigns, instead of waiting for end-of-month reports.
- Automation and integration tools to make sure data flows where it needs to. For example, if you use LinkedIn for outreach, integrate LinkedIn activity into your CRM or reporting tool so those touches aren’t invisible. The goal is one source of truth for outbound metrics.
4. Establish Reporting Cadence and Ownership – Decide how often you’ll review each type of report and who is responsible for them. Not every metric needs daily scrutiny – some might be weekly (e.g., outreach activity numbers), others monthly or quarterly (e.g., overall ROI of outbound).
Set a cadence: perhaps a brief weekly dashboard review for the team, a monthly deep-dive sales analysis meeting, and a quarterly strategy adjustment session.
Also assign ownership: for example, SDR managers might own the weekly activity reports, while sales ops or revenue ops analysts own the monthly performance report. This ensures accountability – data isn’t useful if no one’s actively looking at it and acting on it.
5. Make Reports Visual and Accessible – A strategic report should tell a story at a glance. Use charts, graphs, and tables to make patterns clear.
A busy CMO should be able to scan the report and immediately grasp, say, that the pipeline coverage is 3× short of quota this quarter or that email engagement jumped 15% after a messaging change.
Consider segmenting the visuals by what’s meaningful – e.g., separate charts for each channel (email vs. phone vs. LinkedIn), or funnel stage, or team. Also, ensure reports are easily accessible to stakeholders: via a shared dashboard link, automated email summary, or presentation in team meetings. Transparency is key; when everyone can see the numbers, it fosters alignment and trust in the data.
6. Incorporate Benchmarks and Context – Data by itself lacks context. To know if a metric is “good” or “bad,” include benchmarks or historical trends in your framework.
For example, if your report shows a 10% email reply rate, is that above or below industry average? (Hint: B2B cold emails average around a ~8.5% response rate (9), though top performers can exceed 15%.)
If your outbound team books 20 meetings this month, how does that compare to last month or the same month last year? By layering context, the report becomes actionable – you can celebrate that your reply rate is above average or diagnose why meeting bookings dropped year-over-year. Without context, numbers are just numbers.
Building this framework might seem like a lot of upfront work, but it pays off dramatically. It transforms reporting from a reactive chore (“Ugh, end of month, let’s compile some stats for the execs…”) into a proactive strategic weapon.
A well-built B2B reporting framework lets you manage outbound sales with precision with a real-time dashboard.
Before we drown in theory, let’s get concrete. What specific metrics should you actually be tracking in your outbound reports? The next section breaks down the key metrics and KPIs that form the lifeblood of strategic B2B reporting.
Key Metrics to Track in B2B Outbound Reporting
To turn data into deals, you need to track the right metrics – those that truly gauge performance and guide decisions. In outbound sales, metrics will span the entire funnel from initial outreach to closed deal.
Let’s explore the critical ones, organized by category:
Category
Metric
Purpose / Insight
Activity Metrics
Emails Sent per SDR
Measures outreach volume; ensures reps are sending targeted, quality emails.
Calls Made & Conversations
Tracks outbound call activity and actual human connects; measures effectiveness of phone outreach.
LinkedIn Actions
Counts connection requests, InMails, and engagement; evaluates social selling activity.
Follow-Up Attempts
Average touches per prospect; ensures persistence aligns with best practices (5–12 touches).
Engagement Metrics
Meeting Outreach
Discovery calls or demos booked; outcome of outbound effort.
Email Open Rate
Indicates subject line effectiveness and targeting relevance.
Email Reply Rate
Measures true prospect engagement; separates positive vs. negative responses.
Call Connect Rate
Percentage of calls reaching a human; shows quality of contact info and timing.
LinkedIn Engagement
Connection acceptance and message reply rates; gauges interest on social channels.
Click-Through Rate (CTR)
Measures effectiveness of links in emails (content or scheduling CTAs).
Pipeline & Conversion Metrics
Lead-to-Opportunity Conversion Rate
Tracks how many leads turn into qualified opportunities; assesses lead quality and sales effectiveness.
Opportunity Win Rate (Close Rate)
Percentage of opportunities that close-won; monitors sales effectiveness and targeting.
Average Deal Size
Revenue per outbound deal; compares channel performance and guides targeting strategy.
Sales Cycle Length
Average time to close deals; helps identify bottlenecks and improve planning.
Pipeline Value & Coverage
Total outbound pipeline vs. sales targets; ensures adequate coverage to meet quotas.
Efficiency & ROI Metrics
Cost Per Lead (CPL) / Cost Per Acquisition (CPA)
Measures spend per qualified lead or new customer; monitors profitability.
Revenue per SDR / Campaign
Tracks revenue generated per rep or campaign; evaluates team scalability and performance.
Lead Quality Metrics
Percentage of leads progressing past initial stages or rejected; assesses targeting effectiveness.
Email Deliverability Rate
Bounce rates, spam complaints; ensures messages reach prospects.
Automation & Time Savings
Measures efficiency gains from tools and automation; demonstrates resource optimization.
Activity Metrics: Measuring Outbound Effort
These metrics quantify the top-of-funnel work your team is putting in. They’re crucial because outbound is a numbers game at the outset – without sufficient volume, you won’t fill the pipeline. Key activity metrics include:
- Emails Sent per SDR: How many cold emails each sales rep or SDR sends in a given period. This indicates outreach volume. (Ensure quality control too – 1,000 untargeted emails won’t beat 100 well-researched ones.)
- Calls Made (and Conversations): Number of outbound calls and how many actual conversations took place. With nearly 69% of buyers still answering cold calls (4), call activity remains a lifeline in outbound. It’s important to track not just dials, but connects (conversations) and voicemails left.
- LinkedIn Actions: Connection requests sent, InMail messages sent, and engagement (responses or acceptances). In 2025, LinkedIn is a core outbound channel, so report on those social selling activities too.
- Follow-Up Attempts: How many touches (on average) are made per prospect. Remember that 80% of sales require 5 to 12 follow-ups (6) – so if your team is giving up after one or two touches, that will show in this metric. Tracking follow-up cadence helps ensure persistence.
- Meeting Outreach: The number of discovery calls or demos scheduled (often the end-goal of combined activities). This could also be seen as an outcome, but it’s a direct result of outbound effort, so we list it here as an activity indicator (e.g., booked meetings per SDR per month).
These activity metrics should be viewed in light of targets. If each outbound SDR is supposed to make 50 calls a day and the report shows an average of 30, you know to investigate. On the flip side, if activity is high but results are low, that begs questions of quality over quantity. Strategic reporting keeps an eye on both.
Engagement Metrics: Gauging Prospect Interest
Engagement metrics tell you how prospects are reacting to your outreach. They bridge the gap between raw activity and meaningful conversation:
- Email Open Rate: The percentage of sent emails that were opened. This is your subject line and targeting litmus test. (Across industries, marketing email opens average ~42% (10), but cold B2B emails specifically see around 30–36% open rates on average (5) – if you’re far below that, your subject lines or lead lists may need work.)
- Email Reply Rate: Percentage of emails that received a response (any response). This is a gold metric – it measures true engagement. For cold outreach, a reply rate in the high single digits is common (~8.5% on average (9)). If you’re hitting 15%+, your messaging is resonating. Track positive vs. negative replies too (e.g., replies that convert to opportunities vs. polite “no thanks”).
- Call Connect Rate: Out of total calls, the percentage that reach a human (vs. voicemail). Connect rates might be, say, 5–15% depending on your data and persistence. If your connect rate is very low, consider phone number quality or best times to call. Also track call conversion – what percent of live calls result in a next step (like a meeting scheduled).
- LinkedIn Engagement: Connection acceptance rate and reply rate to your LinkedIn messages. For example, if 100 connection requests were sent and 30 accepted, that’s a 30% acceptance (which is decent if targeting is tight). If your LinkedIn messages after connecting have a 20% reply rate, that’s a strong sign of interest on that channel.
- Click-Through Rates (CTR): If your emails include links (perhaps to content or a calendar booking page), track how often prospects click. A low CTR alongside a healthy open rate could mean your call-to-action isn’t compelling.
Engagement metrics are your early indicators of quality. They answer: are we capturing attention? Are we sparking conversations? If activity metrics are high but engagement is low, you likely have a relevance or targeting problem. For instance, if only 16% of marketers feel outbound efforts generate high-quality leads (4), it often traces back to generic messaging. Use engagement data to push for more personalization and better ICP alignment in your outreach.
Pipeline & Conversion Metrics: From Lead to Deal
To make these conversion metrics more tangible, consider a visual sales pipeline report or dashboard. A well-designed dashboard highlights deals by stage, conversion percentages at each step, and total pipeline value so you can see at a glance where opportunities are concentrated and how they’re progressing. This kind of visual insight helps pinpoint bottlenecks in the funnel and focus your coaching where it’s needed most.
These metrics track how initial interest converts into real sales opportunities and then into revenue. They’re where outbound efforts translate into business impact:
- Lead-to-Opportunity Conversion Rate: Out of all the leads/prospects you engaged (or all meetings booked), what percentage turn into a qualified sales opportunity (SQL or opportunity in CRM)? For example, if 50 meetings led to 10 real opportunities, that’s a 20% conversion. This shows how effective your reps are at turning a first conversation into a sales process. It can reveal the quality of sales ready leads too – e.g., lots of meetings but low conversion might mean many were unqualified.
- Opportunity Win Rate (Close Rate): The percentage of opportunities that eventually close-won as deals. Across industries, average sales win rates hover around 20–30% (6). If your outbound-sourced deals have a much lower win rate than inbound deals, that’s common – but you should still track it and aim to improve through better prospect targeting and sales enablement. A rising win rate over time means your outbound team is getting better at finding “closeable” prospects and your sales team is pitching them effectively.
- Average Deal Size (Outbound): The average revenue per deal for deals generated via outbound. This is useful to compare with other channels. If outbound deal sizes tend to be smaller, you might adjust strategy to target larger accounts, or it might be fine if volume makes up for it.
- Sales Cycle Length: How long do outbound deals take to close on average (from first contact to signed contract)? Maybe your data shows outbound deals take 90 days on average vs. 60 days for inbound – that’s not unusual, since outbound often means starting cold. But tracking this helps with planning and highlights if cycle time is improving or worsening. If your sales cycle is lengthening, reporting will catch that and you can dig into why (are decision makers looped in too late? Are follow-ups inconsistent? etc.).
- Pipeline Value and Coverage: How much pipeline (in $$) is your outbound generating, and how does that compare to your sales targets? A common metric: pipeline coverage ratio – pipeline value divided by quota. For example, if an SDR team’s outbound efforts have $500k in pipeline for a quarter and the sales quota is $1M, coverage is 0.5× (probably insufficient). We generally aim for 3–4× coverage to account for typical win rates. Regular reporting on outbound pipeline value by stage helps management see if they’re likely to hit future targets or if there’s a shortfall brewing.
These conversion metrics are the core of ROI measurement for outbound. They connect the dots from initial hustle to signed deals. An uptick in lead-to-opportunity rate or win rate directly translates to more revenue from the same effort – exactly what you want. And if those rates are below benchmark, you know where to focus training or process improvements (for instance, improving discovery call techniques to boost that lead-to-opportunity percentage).
Efficiency & ROI Metrics: Quality and Cost Effectiveness
Lastly, strategic reporting should cover how efficient your outbound engine is. It’s not just about generating pipeline, but doing so sustainably and profitably:
- Cost Per Lead (CPL) and Cost Per Acquisition (CPA): Calculate how much you spend to generate each qualified lead or each new customer via outbound. This includes the portion of salaries, tools, and any data purchase allocated to outbound. For example, if your outbound team of 3 SDRs costs $15k/month and they generate 30 SQLs/month, your CPL is $500. Monitoring CPL trends ensures your customer acquisition cost is under control. If outbound CPL starts exceeding that of other channels (like inbound marketing), you may need to optimize workflows or targeting.
- Revenue per SDR (or per campaign): How much revenue is being driven per sales rep or per outbound campaign. This helps justify the program and headcount. If each SDR consistently books deals worth $X per quarter, and that number is growing, it shows scalability. If it’s shrinking, it flags an issue (maybe they’re spending time on too many low-value accounts).
- Lead Quality Metrics: This is more qualitative, but you can quantify it by looking at things like: What percentage of outbound leads are rejected by sales or never progress past initial meeting? What’s the churn rate of customers acquired via outbound (are they high churn or solid long-term clients?). High churn or low lifetime value might indicate the outbound team is pulling in prospects that aren’t an ideal fit just to hit meeting quotas. A strategic report will surface those patterns so you can refine your targeting criteria.
- Email Deliverability Rates: One often overlooked efficiency metric in cold outbound emailing is your bounce rate or sender reputation measures. If 15% of your emails are bouncing or going to spam, that drags down the whole effort. Tracking email deliverability (bounce rate, spam complaint rate) in reports can alert you to issues like needing better list scrubbing or domain warm-up. Effective outreach means nothing if messages don’t reach inboxes.
- Automation & Time Savings: If you’ve implemented automation tools, you might report on efficiency gains like “emails sent per rep” before vs. after, or hours saved on research due to a data tool. This isn’t a traditional metric, but showcasing how your strategy makes the team more efficient is important for leadership buy-in. For example, using an AI tool to compile prospect intel might cut research time by 50% – meaning reps spend more time selling.
Collectively, these efficiency metrics tell you how well you’re converting effort into results, and at what cost. A big win is when you can report something like: “This quarter, with the same outbound team and budget, we generated 25% more pipeline and lowered our CPL by 15% compared to last quarter.” That’s music to any executive’s ears, and it’s the kind of insight strategic reporting enables.
Sales activity dashboard example:
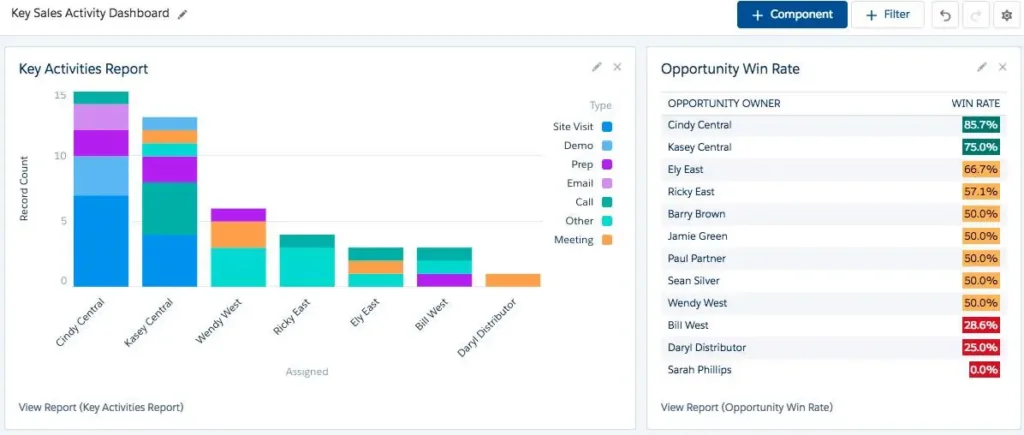
Source – Salesforce, Sales Activity Analysis Dashboard
Above is a sample of how an outbound activity and results dashboard might look. With critical metrics in view, you can quickly spot correlations (e.g., a spike in emails leading to a boost in new opportunities) and anomalies (e.g., lots of calls but few connects on a certain week).
The key is to use these metrics not just as numbers to report upward, but as intelligence to improve internally. In the next section, we’ll explore how to analyze the data and turn these reporting insights into concrete actions.
Analyzing Outbound Data for Strategic Insights
Outbound efforts often account for around 28% of B2B revenue, making it a critical growth lever.
Reference Source: Martal Group
Collecting data is only half the battle – the real payoff comes from analyzing that data to extract insights and drive strategy changes. Strategic B2B reporting means you don’t just present numbers; you interpret them. Here’s how to analyze your outbound reports for maximum insight:
Find the Story in the Trends: Look at how your key metrics move over time and in relation to each other. Are email reply rates steadily climbing month over month after that new personalization initiative? Did your pipeline value dip in the summer months?
For example, you might notice that when email open rates jumped from 25% to 40% (perhaps after improving subject lines), your demo bookings rose the following week. That’s a narrative: better top-of-funnel engagement is feeding more meetings.
By contrast, if activity stayed high but conversion rates fell, the story might be “market fatigue” or message ineffectiveness. Always ask “Why is this metric changing?” – the answer often reveals actionable strategy tweaks.
Segment Your Data for Deeper Insight: Averages can obscure important details. Break down metrics by meaningful segments to see differences. For instance:
- By Sales Rep: Does one SDR have a 15% reply rate while another has 5% with the same volume? Investigate their techniques and share best practices from the high performer (or identify coaching needs for the laggard). Public dashboards can even spark friendly competition by showing each rep’s booking numbers – we’ve seen teams boost performance simply by making the data visible.
- By Industry or Persona: Perhaps your outbound team targets multiple verticals. Reporting might show that the finance industry prospects have half the conversion rate of healthcare prospects. That insight could lead you to refine the value prop for finance, or reallocate effort toward the more responsive industries. Similarly, if C-level contacts rarely respond but mid-level managers do, adjust who you reach out to first.
- By Channel: If you run multi-channel outbound (email, phone, LinkedIn), segment engagement and results by channel. You may find, for example, LinkedIn InMails yield fewer total leads but a significantly higher lead-to-opportunity conversion (maybe because those prospects are more receptive). This could justify investing more in the channels with the best downstream payoff, not just the most initial responses.
- By Sequence or Message: Analyze which cadences or email templates perform best. If your data shows Sequence A (short 3-touch sequence) yields a 10% meeting rate while Sequence B (long 7-touch sequence) yields 15%, you have evidence to iterate your outreach playbook. Likewise, A/B tests on subject lines or cold call scripts should be reported: what variant won, and what was the uplift? Using the data, we continually refine templates – turning reporting into a feedback loop for campaign optimization.
Identify Bottlenecks and Drop-offs: Funnel metrics in your report will highlight where sales leads fall off. You might see, for instance, plenty of prospects agreeing to a call (high meeting scheduled rate) but then a low opportunity creation rate from those meetings. That tells you the problem is likely after the initial hook – maybe the discovery calls are not compelling or there’s a disconnect turning that interest into a real project.
Conversely, you could see strong conversion to opportunity but deals stalling in proposal stage – indicating pricing or product fit issues. By pinpointing the stage with the biggest drop-off, you know where to focus improvement efforts.
Many outbound teams find that the initial interest is easy to spark, but the handoff to AEs or the follow-through is where they need better support – which could mean training, better sales collateral, or clearer lead qualification criteria.
Compare to Benchmarks and Goals: When analyzing, always contextualize numbers against your targets and external benchmarks. If your goal was to generate $500k in pipeline and the report shows $400k, you’re at 80% of goal – dig into why. Maybe one rep underperformed or one segment didn’t hit expectations.
Externally, if your email open rate is 30% and the industry average is ~36% (5), that’s a gap to investigate – are your contact lists less clean, or your subject lines weaker than competitors’?
On the other hand, if you find your outbound team’s contribution is 28% of total sales revenue (versus, say, 72% from inbound and other sources), compare that to industry context.
Outbound sales often drives ~28% of revenue in many B2B organizations (8). Knowing this, you can argue for scaling outbound further (if you’re below benchmark and see room to grow) or for resource balance (if outbound is shouldering more than typical, ensure inbound marketing gets attention too). Benchmarks turn raw data into strategic insight about where you stand.
Ask Qualitative “Why” Questions: The reports won’t always tell you the “why” directly; that’s where analysis and sometimes human input come in.
Use your team to interpret the numbers. If the data shows prospecting emails to the tech industry suddenly underperformed in October, gather the SDRs or AEs and ask if they noticed anything – e.g.,
Was there a big tech conference that month drawing attention away?
Did our email deliverability dip?
If call contact rates jumped after a certain date, was it because we started calling direct lines instead of switchboards?
Encourage reps to annotate or comment on their metrics in review meetings (“I see my numbers dipped last month; one big account pushed our meeting, which hurt my opp count”). These qualitative insights alongside the quantitative data complete the picture.
Leverage AI for Deeper Analysis: In 2025, don’t overlook AI tools that can analyze patterns you might miss. Some CRM and analytics platforms now have AI-driven insights that point out, for example, “Leads from X source convert 30% better” or “Deals in Y industry have a 10-day shorter sales cycle.”
We at Martal have invested in AI-driven sales ops that scan our outreach data (3,000+ intent signals as mentioned earlier) to suggest optimizations. AI can quickly crunch through multivariate data – like time of day of outreach, sequences, content of messages – to find correlations (maybe emails sent on Tuesday mornings get 1.5× replies, or mentioning a certain value prop increases engagement). By integrating those findings into your reports, you get strategic recommendations, not just backwards-looking data.
In summary, analyzing your outbound reports with a critical, curious eye turns them from static charts into a dynamic decision tool. The goal is to evolve from simply reporting what happened to understanding why it happened and what to do next. That’s the essence of making reporting strategic. In the next part, we’ll take those insights and discuss how to apply them – how to turn your reporting analysis into concrete actions that improve your outbound results.
From Reporting to Strategy: Turning Insights into Action
80% of sales require 5–12 follow-ups, but many reps give up after 1–2 attempts.
Reference Source: Marketing Donut
Data and insights alone don’t move the needle – action does. The true value of strategic B2B reporting is realized when you use it to make better decisions and refine your outbound strategy. Here’s how to translate reporting insights into game-changing actions:
Double Down on What Works: Sounds obvious, but how often do we actually do it? When reporting identifies a winning tactic, make sure to capitalize on it.
For example, if your analysis shows that personalized video messages in emails yielded an extra 5 meetings last quarter, consider rolling that tactic out across the team. If calls convert higher in the healthcare vertical, maybe it’s worth increasing call volume or hiring another SDR with experience in that space.
Data-backed successes give you confidence to invest more where it counts. One of our clients saw that outreach emails mentioning a specific pain point (compliance risk) had a 30% higher reply rate than other messages – so we revised our templates to lead with that angle more broadly.
The result? Their overall outbound response rate jumped and we booked more meetings with enterprise accounts who cared about compliance. Insight in, strategy out, results up.
Fix or Pivot What Isn’t Working: On the flip side, use the data to fail fast and adjust. If a particular campaign or sequence consistently underperforms, don’t keep pushing it out of habit.
Say your “webinar email follow-up” sequence has a dismal 2% reply rate whereas your cold introduction sequence is at 10%. Perhaps the webinar leads aren’t as warm as assumed – you might pivot to treat them more like cold leads, or stop that sequence and try a different approach entirely (like a phone call follow-up instead of email).
If an SDR’s territory is yielding poor results quarter after quarter (and you’ve verified it’s not just their technique), maybe the data is telling you that market segment is tapped out or not a good fit – time to reassign that rep to a more fertile patch. Strategic reporting gives you the backing to make these tough calls with confidence rather than guesswork.
Align Team and Stakeholders with Data: Use your reports as alignment tools. When sales and marketing sit down together, bring the outbound report. It can highlight, for instance, that inbound leads convert 2× better than outbound or vice versa, which informs resource allocation and expectations. If 54% of sales leaders say better sales-marketing alignment boosts revenue (12), sharing common data is one way to achieve that alignment.
Your reporting can also justify investments: if the data shows outbound is yielding high ROI, it’s a case to hire more SDRs or increase the data/tools budget. Conversely, if a strategy isn’t paying off, the report helps communicate the need to change course to senior leadership. At Martal Group, we often use outbound performance reports to have frank conversations with clients about strategy – e.g., “Industry X isn’t responding well, but Industry Y is – let’s reallocate target accounts accordingly.” The data takes emotion out of the discussion and centers it on facts.
Implement Continuous Training and Optimization: Turn insights into coaching moments. Suppose your report reveals one rep has a significantly higher conversion from meetings to opportunities – dig into why. Maybe they excel at discovery calls; have them share their approach in a training session. Or if the data shows emails with a certain structure perform poorly, do a team huddle to rewrite that template together. Use concrete numbers (like “Only 3% of our calls this month led to a next meeting – what can we improve in our call approach?”) to pinpoint coaching areas. Many teams establish a routine where each week or month, a different metric is discussed and improved. One week, focus on improving open rates (brainstorm new subject lines, test, and report next time). Next, focus on call techniques to boost connect or conversion rates. This systematic optimization, driven by what the numbers say needs attention, leads to compounding gains.
Iterate on Your Ideal Customer Profile (ICP) and Messaging: Outbound reporting provides a feedback loop to refine your targeting and messaging strategy. If data shows a certain profile of company has very low engagement, perhaps you need to tighten or change your ICP definition – target slightly smaller companies, or different job titles, etc. Similarly, if a specific value proposition in your messaging isn’t resonating (e.g., your “save money” pitch falls flat but your “increase security” angle gets replies), adjust your core messaging to emphasize what works. Strategic sales development is very much about testing and iterating – your reports are the scorecard that tell you which experiments win. Over time, this leads to a finely tuned outbound formula unique to your business. For instance, you might learn through data that “companies using XYZ software respond at a much higher rate” – a strong signal to mine that technographic data and focus campaigns there, perhaps even tailoring messaging around “We integrate with XYZ software…”.
Close the Loop with Outcomes: After making changes, always loop back to the data to see the impact. This is where reporting becomes a continuous cycle rather than a one-time audit. If last quarter’s report led you to implement three changes, check this quarter’s numbers to see if those had the intended effect. Did the new cadence improve conversion? Is the new target vertical showing better engagement? By closing the loop, you validate strategies or learn and adjust again. This continuous improvement mindset is what makes your reporting truly strategic – it’s not static documentation, it’s an evolving playbook. Many of our own success stories at Martal came from this cycle: for example, data showed our initial outreach in Europe was underperforming (different business culture), so we changed our approach (more relationship-focused touches) and the next report showed a marked uptick in EU prospect engagement. Without that loop of insight -> action -> insight, we might have just concluded “Europe is tough” and left value on the table.
At the end of the day, strategic reporting is about making your outbound engine smarter every cycle. It’s the GPS that recalculates the route when you hit traffic, ensuring you still get to the destination (more deals) as efficiently as possible. When you consistently act on your reporting insights, you’ll find that your outbound program isn’t static – it’s dynamically adapting and improving, guided by real data from your market.
Tools and Best Practices for Effective B2B Reporting
39% of sales professionals say poor data quality hinders accurate forecasting, but automation can keep lists clean and improves sales predictions.
Reference Source: Salesforce
Having the right process is crucial, but so is having the right toolkit and habits to support your strategic reporting. Let’s discuss some tools and best practices that can elevate your B2B outbound reporting in 2025:
Invest in a Unified Data Platform: We touched on CRM and BI tools earlier – the core idea is to have one place where your data lives and can be reported on. If your SDRs log emails in Outlook, calls in a power-dialer, and meetings in Google Sheets, you’ll struggle to consolidate reporting.
A CRM integrated with your email, calling, and LinkedIn tools, ensures all activities funnel into a single database. From there, you can build reports or use BI dashboards on top. The fewer places you have to pull data from manually, the more reliable (and frequent) your reporting can be. Data silos are the enemy of good reporting. If you find gaps (e.g., LinkedIn outreach not tracked), solve them with integration or even manual logging as a stopgap – it’s worth it to complete the picture.
Automate Data Collection and Reporting: Today’s tools allow a lot of automation – use it to reduce human error and save time. Schedule automatic report deliveries (e.g., a dashboard screenshot or PDF that emails to stakeholders every Monday morning).
Use real-time alerts for certain conditions: for instance, if daily email send volume drops below a threshold or if a spike in bounces occurs, you can have the system flag it immediately.
Automation can also help with data hygiene – e.g., automatically removing hard-bounced emails from sequences to keep lists clean, since incomplete or bad data is a major obstacle (some 39% of sales professionals say poor data quality makes accurate forecasting challenging (13)). The less your team has to remember to update spreadsheets or manually compile numbers, the more they can focus on analysis and action.
Keep Reports Simple and Actionable: Especially when presenting to executives or non-technical stakeholders, clarity is key. Don’t overwhelm with 50 different metrics in a weekly summary. Focus on a core set of sales KPIs and use simple visuals.
A best practice is to have a “metrics snapshot” at the top of a report: e.g., Emails sent: 1,000 (+10%), Response rate: 9% (+2%), Meetings booked: 30 (-5), Pipeline generated: $200k (+$50k), etc., with green/up or red/down indicators. Busy readers get the gist in seconds.
Then you can include detail and breakdowns below for those who want to dig in. Also, tie metrics to actions in the report commentary: “Open rates down 5% – plan: implement new subject lines; Pipeline coverage at 2.5× – slightly below goal, need to source 20 more opportunities.” This way, the report itself drives the conversation towards what to do next.
Ensure Data Accuracy and Consistency: A reported metric is only useful if everyone trusts it. Invest time in setting up reports correctly and auditing them periodically. Does everyone log activities properly? Are the date ranges and definitions consistent? For example, define what counts as a “lead” or “SQL” clearly so that when you report those numbers, there’s no confusion.
One best practice is to create a data and sales glossary as part of your framework, so terms like “MQL”, “SAL”, “SQL”, etc., are unambiguous. Also be cautious of over-attribution – e.g., if two teams touch a deal, be clear in reporting if you’re counting it as outbound-sourced, inbound, or split. We’ve found that transparency in how metrics are calculated quells a lot of debates and keeps everyone focusing on improvement rather than questioning the data.
Use Visual Aids and Templates: Don’t reinvent the wheel each time. Develop a standard reporting template/dashboards that you refine over time. That might include a funnel chart showing drop-off at each stage, a leaderboard of SDR productivity, and trend graphs for key rates. Visual aids like funnel diagrams or bar charts for month-over-month results make the data intuitive. Many tools and communities (like Salesforce’s AppExchange or HubSpot’s template gallery) offer pre-built dashboard templates – these can be great starting points. The consistency of using a template also helps with comparing periods. Stakeholders will get used to the format (“this is the page where I see pipeline metrics”) which speeds up comprehension. For instance, a simple table of metrics by quarter can be powerful to spot seasonality or progress: you might maintain a table of, say, Q1 vs Q2 vs Q3 stats for opens, replies, meetings, opps, wins. Seeing that all in one view makes it easy to recognize improvements or declines.
Stay Agile and Update KPIs as Needed: The outbound landscape can change, and so should your reporting. You might adopt a new channel (say, SMS prospecting or WhatsApp outreach) – if it becomes significant, integrate it into the reports. Or, external factors like privacy regulations could reduce what data you can collect (for example, email open rates became less reliable for some Apple mail users due to privacy changes).
In such cases, you might shift focus to other engagement metrics. Also, as your company goals evolve (e.g., maybe a greater focus on enterprise deals vs. SMB volume), adjust lead generation KPIs to align (perhaps tracking average deal size more closely, or ABM-style engagement metrics). In short, review your reporting framework at least annually to ensure it still serves your strategic needs. Don’t be afraid to add or drop metrics. We recommend keeping a “core” set that remain year-round for continuity, but have a couple of flexible spots for metrics-of-the-quarter that you swap in based on current initiatives.
Secure Team Buy-In for Reporting: Last but not least, cultivate a culture where the sales team actually values reporting rather than dreading it. That means two things: minimizing reporting drudgery on them (through automation as said, and making data entry easy), and showing them the personal benefit.
Use reports in 1:1s to help reps earn more commission (“let’s see where in your numbers we can unlock more meetings or deals”). Celebrate wins with data – “Congrats to Alice for 120% of quota – and check the dashboard, she also has the highest call-to-meeting conversion rate, let’s give a hand!”
When reps see data highlighting their success and helping them improve, they’ll be more motivated to keep the data clean and pay attention to reports. It stops being about “big brother” and starts being about professional development and winning as a team.
Incorporating these tools and practices turns reporting from a tedious task into an integral part of your sales operations. The result is a more efficient, transparent, and proactive outbound lead generation engine.
As we embrace new technology like AI, these fundamentals ensure we’re ready to leverage them fully – because if your data foundation is solid, layering AI insights or advanced analytics on top can skyrocket performance.
Speaking of technology and the future, let’s look ahead at some emerging trends in B2B reporting that are shaping how we approach outbound data.
AI and the Future of B2B Outbound Reporting
Sales teams using AI are 1.3× more likely to exceed revenue goals.
Reference Source: Salesforce
No discussion of 2025 would be complete without talking about Artificial Intelligence (AI) and automation – and their impact on B2B reporting. The good news is that AI isn’t here to replace salespeople; it’s here to make reporting and analysis smarter, faster, and more predictive. Here’s how AI is reshaping outbound reporting:
- Predictive Analytics for Lead Scoring: Traditional reports are descriptive (what happened) or diagnostic (why it happened). AI enables predictive insights (what’s likely to happen). For outbound, one game-changer is AI-driven lead scoring and deal scoring. By analyzing historical data on what prospects converted (industry, role, engagement level, etc.), machine learning models can score new prospects in your funnel on their likelihood to become customers.
Your reports might soon include an “Opportunity Win Probability” for each deal or a health score for each lead. This lets sales prioritize efforts on the most promising deals. High-performing teams are already using this – for instance, Salesforce research shows sales teams using AI are 1.3× more likely to have higher revenue growth (7) than those who don’t, partly because they focus on the right deals. Imagine seeing in your dashboard that an inbound lead has an 80% win score while a cold outbound one has 20% – you’d know where to deploy the A-team versus a nurture track.
- Real-time Coaching and Next-Best Actions: AI can analyze live data from conversations and engagements to suggest improvements on the fly. Some advanced sales platforms offer real-time call coaching (transcribing calls and flagging if the rep is doing too much talking, for example).
For reporting, this means the feedback loop shortens dramatically. Instead of waiting for end-of-month metrics to tell a rep “your talk-to-listen ratio is off,” AI can whisper it during or right after a call.
Similarly, AI can recommend next-best actions: “Lead John Doe hasn’t responded to two emails but opened both – next best action: try a LinkedIn message on Day 3.” These insights can appear directly in your CRM, effectively turning your reporting system into a smart assistant. As a result, the line between reporting and executing blurs – the moment data comes in, AI helps you act on it.
- Natural Language Reports & Queries: Not everyone loves poring over charts. AI is making reporting more accessible via natural language. You might not be far from simply asking, “Hey CRM, what was our conversion rate from lead to deal for healthcare accounts last quarter versus this quarter?” and getting an instant answer or a generated mini-report in plain English (or in a visual). Tools like GPT-based analysis are starting to allow conversational queries on sales data.
This can empower managers and reps who are less analytics-savvy to still extract value from the data without running to an analyst for every question. It’s all about democratizing data access.
In practice, this could look like a chatbot or voice assistant that briefs you each morning: “Today, you have 5 high-scoring leads to follow up, and your email response rate is up 3% this week. Good job!”
- Anomaly Detection and Alerts: AI excels at finding patterns – and recognizing when something is off-pattern. For outbound, this means your systems can automatically flag anomalies that merit attention.
For example, if normally your team books 10 meetings a week and suddenly this week you only hit 4 by Thursday, an AI-driven system might alert: “Meeting bookings are 50% below average pace.” Or if one rep’s performance spikes, it might notify: “Rep Jane has 3× the average reply rate this week.” These early warnings and highlights make your reporting proactive.
Think of it as a safety net; you don’t have to set manual thresholds for every metric, the AI learns what’s “normal” and tells you when reality deviates significantly. This ensures you can respond quickly to both problems (e.g., campaign issue, data outage, etc.) and opportunities (e.g., a tactic that suddenly went viral and is getting huge response – time to capitalize!).
- AI-Enhanced Data Targeting: Outbound success starts with who you target, and AI is supercharging that too – which feeds back into reporting quality. Instead of relying purely on static lists, companies are using AI to identify lookalike prospects or signals of intent.
For instance, our AI SDR platform taps into intent data – tracking 3,000+ buying signals as mentioned – to refine who we target. That means our outbound campaigns begin with “smarter” data, and our reports reflect higher conversion because we’re fishing in a stocked pond, so to speak.
In your own strategy, leveraging AI tools that comb through social media, news, and online behavior to suggest prospects showing interest in solutions like yours can drastically improve your outbound efficiency.
Your reports will show the difference (e.g., a jump in lead quality and down-funnel conversion after implementing an AI-based list building tool). Essentially, AI can front-load your funnel with better opportunities, making the subsequent reporting a lot more gratifying!
While AI offers incredible capabilities, a word of caution: it works best paired with human judgment. We still need sales leaders to validate insights, sense-check anomalies, and add the human touch in decision-making.
But used wisely, AI becomes a force multiplier for your outbound reporting – handling the heavy data crunching and pattern-finding, so your team can focus on strategy and relationship-building. The future of B2B reporting will likely be a collaboration between human and artificial intelligence, delivering deeper insights faster.
Adopting these AI-driven tools and techniques can give you a serious edge. Companies slow to incorporate AI may find themselves at an analytical disadvantage. But even as we embrace the future, the fundamentals remain – clear goals, the right metrics, and a culture of action.
With all this ground covered – from fundamentals to future trends – you should be well-equipped to transform how your organization approaches outbound reporting.
Conclusion: From Data to Deals – Your Path to Outbound Success
Outbound success in 2025 boils down to one core capability: turning data into actionable strategy at every step. When you build strategic B2B reporting into your sales DNA, you stop flying blind and start navigating by a reliable compass. You’ll know which prospects to pursue, which tactics to tweak, and where to invest for the highest payoff – all backed by real metrics, not guesswork. The end result? More qualified leads, more efficient pipelines, and ultimately more closed deals.
We’ve covered a lot of ground: setting up a reporting framework, tracking the metrics that matter, analyzing those reports for strategic insight, and leveraging new tools (from dashboards to AI) to supercharge the whole process. The message is clear – data-driven outbound reporting is no longer a “nice-to-have” but a “must-have” for B2B sales teams that want to thrive. It’s the engine that lets you rinse, refine, and repeat your way to continually better results.
The exciting part is that you don’t have to do this alone. If reading this has you thinking, “This sounds great, but it’s a lot to implement,” that’s where we come in. At Martal Group, we live and breathe B2B outbound. We have spent over a decade refining the art of turning data into deals for our clients – from startups hunting their first enterprise logos to Fortune 500s scaling into new markets. Our team acts as an extension of your team, bringing the reporting rigor, the AI-powered tools, and the seasoned expertise to your outbound program. We handle the heavy lifting – building targeted lists with our AI-driven platform, executing omnichannel lead generation outreach, and providing transparent reporting on performance – so you get a predictable stream of qualified meetings and sales opportunities.
Ready to transform your outbound results through strategic reporting and expert execution? Let’s talk. We invite you to book a free consultation with Martal Group. We’ll assess your current outbound approach, show you how our data-driven methodology can fill your pipeline with high-quality leads, and craft a plan to help you consistently hit (or exceed) your revenue targets.
Your 2025 outbound success story can start now – with the right data, the right strategy, and the right sales partner by your side. Let’s turn your data into deals, together.
References
- Gartner
- Ebsta
- HubSpot
- BookYourData
- Focus Digital
- Spotio
- Salesforce
- Martal Group – Outbound Sales
- Beehiv
- HubSpot – Email Open Rates
- RAIN Group
- Marketing Donut
- Salesforce – Sales Statistics
FAQs: B2B Reporting
What does B2B mean in data?
B2B stands for “Business-to-Business.” In data terms, it refers to company-level and professional contact information used for targeting, engagement, and analytics in B2B sales. Unlike B2C data, which focuses on consumers, B2B data powers outbound prospecting and strategic reporting in enterprise environments.
What are the 4 types of B2B?
The four main types of B2B buyers are:
1. Producers – companies that use your product to create theirs.
2. Resellers – businesses that resell your product or service.
3. Governments – public-sector entities that require B2B procurement.
4. Institutions – nonprofits, hospitals, and universities purchasing for operations.
Each type has distinct decision-making processes and requires tailored outreach strategies.
What are the 7 P’s of B2B?
The 7 P’s of B2B marketing include:
Product, Price, Place, Promotion, People, Process, and Physical Evidence.
They guide how businesses structure their go-to-market strategy, from crafting offers to engaging stakeholders. For B2B sales, people, process, and proof points play a critical role in long sales cycles and complex buying decisions.
