2026 Sales Analysis Trends: How AI & Data Analytics Are Reshaping Outbound Sales Performance
Major Takeaways: Sales Analysis
Sales analysis reflects real-time market reactions through data already sitting in your CRM, outreach platform, and rep activity logs — no expensive research project required.
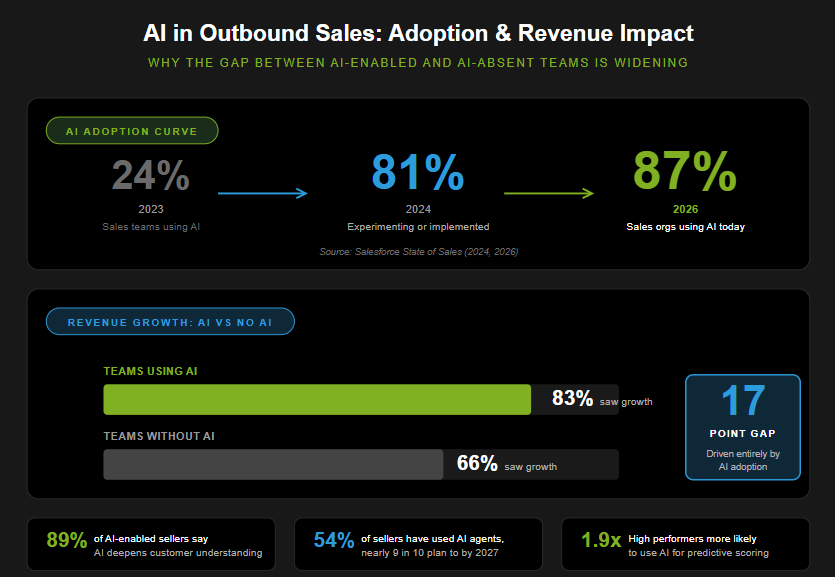
87% of sales teams now use AI for tasks like prospecting, forecasting, and lead scoring — and teams with AI are seeing meaningfully higher revenue growth than those without it.
Focus on both outcome KPIs (win rate, deal size, quota attainment) and input KPIs (touchpoints, meetings set, lead response time) to see not just what was achieved, but how.
Funnel analysis shows where prospects drop off; analyzing conversion rates at each stage reveals whether the issue is targeting, messaging, qualification, or timing.
Teams using trend analysis and AI forecasting tools achieve roughly 10% higher revenue predictability and tighter quota accuracy — especially when forecasts draw on pipeline coverage ratios, not just deal-stage guesswork.
Trend, pipeline, product, segment, and win/loss analyses each answer a different question. Run together, they deliver a 360° view of performance that single-metric dashboards can’t match.
Sales and marketing analysis exposes which lead sources actually convert, so the team can stop arguing about lead quality and start focusing resources on the high-ROI segments the data points to.
High-performing teams review sales analytics weekly or monthly, using live dashboards to adjust strategy in real time — not quarterly reports that land after the window to act has already closed.
Introduction
Sales analysis has moved out of the back office and into the boardroom. In 2026, it’s where revenue leaders find the answers their dashboards alone can’t give them: what’s actually working, what isn’t, and where to put the next dollar of pipeline investment.
Every cold email, call, LinkedIn touch, and CRM update generates data. The teams pulling ahead are the ones treating that data as evidence — feeding it into AI models that score buying intent, forecast revenue, and surface the patterns no human analyst would catch in time to act. The teams falling behind are still running quarterly reviews on stale spreadsheets and calling it strategy.
This guide walks through what sales analysis covers, why it’s a competitive necessity right now, the seven types of analysis that matter most for outbound teams, and a step-by-step process for turning your sales data into decisions you can defend. We’ve also pulled in real results from a few of our own client engagements where the numbers tell the story better than theory does.
This article draws on research from Salesforce’s 2026 State of Sales Report (2), McKinsey research on personalization, and forecasting and pipeline benchmarks from sources we’ve cross-referenced against what we see daily in B2B outbound campaigns at Martal.
Whether you run sales for a SaaS company, a manufacturer, a fintech platform, or a services firm, the same principle applies: data-driven outbound isn’t optional anymore. It’s the floor.
What Is Sales Analysis and Why Does It Matter in 2026?
5% higher productivity and 6% higher profits are reported by companies that make decisions based on performance data.
Reference Source: Forecast.io
Sales analysis is the process of collecting, examining, and interpreting sales data to evaluate performance and identify improvement opportunities (1). In practice, it means auditing every part of your sales operation — leads, conversion rates, rep performance, revenue trends — to understand what’s working, what isn’t, and why.
Three reasons sales analysis matters more in 2026 than it ever has:
- Data-driven decisions outperform intuition. Companies that use performance data to guide decisions report up to 5% higher productivity and 6% higher profits than peers relying on gut feel. In a market where AI-enabled competitors are compressing sales cycles by weeks, that gap compounds quickly (3).
- Sales data is your fastest market feedback loop. Every reply, no-show, lost deal, and closed contract carries information about your buyer’s reality — pricing pressure, competitor activity, product fit, timing. Analyzing that data means listening to your market in real time, not waiting for the next quarterly review.
- Early signals prevent late surprises. Are conversion rates slipping at the demo stage? Is one region underperforming? Is a rep consistently missing quota despite high activity? These show up clearly in a structured sales analysis — and almost always show up earlier than they show up in revenue.
We’ve seen this pattern firsthand. In a 15-month outbound engagement with a US-based LED and solar equipment company targeting manufacturing, healthcare, warehouses, and retail, ongoing segment-level analysis is exactly what drove the result: 316 leads, 218 SQLs, and 196 booked meetings — a lead-to-SQL conversion rate above 60%. That outcome didn’t come from a one-time campaign setup. It came from continuously analyzing which verticals were responding, which messaging variations were converting, and where to double down each week.
In 2026, with AI startups disrupting industries on a quarterly cadence and buyer behavior shifting faster than annual planning cycles can keep up with, the companies that thrive are the ones continuously analyzing and adapting based on real data. Sales analytics isn’t a report that lands in your inbox once a quarter. It’s a strategic weapon — and the teams treating it that way are the ones widening the gap.
Data Analytics in Sales – The Foundation of Performance Improvement
Organizations that monitor pipeline metrics and conversion rates are 10% more likely to achieve year-over-year revenue growth.
Reference Source: Forbes
We’ve covered why analyzing sales data is important. Now let’s get into how data analytics in sales actually drives performance. Sales data analytics means applying statistical analysis — and increasingly, machine learning — to your sales records to extract patterns and act on them. It’s the difference between knowing your win rate dropped and knowing why.
Four ways analytics drives better outbound performance:
- Identifying high-impact KPIs. Strong sales analytics starts with measuring the right sales KPIs and lead tracking — not just revenue, but a balanced mix of outcome metrics (win rate, average deal size, quota attainment) and input metrics (calls made, emails sent, meetings booked, qualified appointments). Looking at both reveals not just what was achieved, but how. If outreach activity is high but win rates are low, the issue is lead quality or sales execution. If win rates are healthy but pipeline volume is thin, the gap is at the top of the funnel. Either diagnosis is invisible if you’re only watching the lagging revenue number.
- Revealing conversion funnel dynamics. Sales pipeline analysis visualizes conversion at every stage. Out of 1,000 cold outreach attempts, maybe 100 leads land (10% lead rate), 30 of those book a meeting (30% to appointment), and 10 close (33% win rate from meetings). Tracking those ratios over time exposes the biggest drop-offs. A lot of meetings but few closes points to a late-stage problem — product fit, proposal quality, or stalled decision-making. Few prospects converting in the first place points to targeting or messaging. Organizations that systematically measure pipeline metrics and conversion rates are roughly 10% more likely to grow revenue year over year than those running on lagging indicators alone, because they catch pipeline management issues before the quarter ends.
- Segmentation and cohort analysis. Aggregate numbers hide the most important insights. Slicing by region, industry, company size, rep, product line, or campaign exposes patterns that totals smooth over. Imagine flat overall sales — but a closer look shows Product A grew 20% while Product B dropped 15%. Or one rep’s strong numbers are masking another’s underperformance. Or leads from LinkedIn outreach close at twice the rate of leads from cold calling for a specific vertical. We see segment-level patterns drive most of the highest-leverage decisions in outbound. In a 14-month engagement with a New York-based industrial tools and printing equipment manufacturer entering the US electrical and safety market, segment analysis at the vertical and persona level was central to delivering 1,596 leads, 1,364 MQLs, 203 SQLs, and 107 booked meetings. The client had tried two other providers before us; segment discipline is what made the third try work.
- Trend analysis and forecasting. Historical data exposes seasonality, growth trajectory, and early warning signs. Maybe Q3 dips every year and Q4 spikes — recognizing the pattern means preparing pipeline generation earlier and shifting budget before the rush. With enough history, forecasting models can project forward, factoring in growth rates and external signals. Modern analytics often pulls in economic indicators or industry trends to refine predictions. Companies with accurate, analysis-grounded sales forecasts are roughly 10% more likely to grow revenue than those forecasting on intuition alone (5).
B2B Sales Prospect Data Analysis Methodology
For B2B teams, prospect data analysis isn’t a single technique — it’s a layered methodology that connects firmographic data (industry, company size, geography), technographic data (tools and platforms in use), behavioral data (engagement signals, content interactions), and intent data (active research signals, hiring patterns, funding events). The output of a strong prospect data analysis methodology is a ranked, segmented list of accounts where the data tells you who is most likely to convert, why, and when to reach them.
In practice, the methodology looks like this:
- Define the ICP at the firmographic layer — industry, revenue band, employee count, geography, growth stage
- Layer technographic and behavioral signals — what tools they use, what content they engage with, what events they’ve attended
- Apply intent scoring — surface accounts showing active buying signals through content consumption, hiring patterns, or funding events
- Score and rank — combine the layers into a prioritized account list, with conversion probability attached
- Re-score continuously — accounts move in and out of the buying window; static lists go stale within weeks
This methodology is the analytical backbone behind every well-run outbound program. It’s also the difference between sending 5,000 emails to a flat list and sending 500 emails to a prioritized one — and getting more pipeline from the second motion.
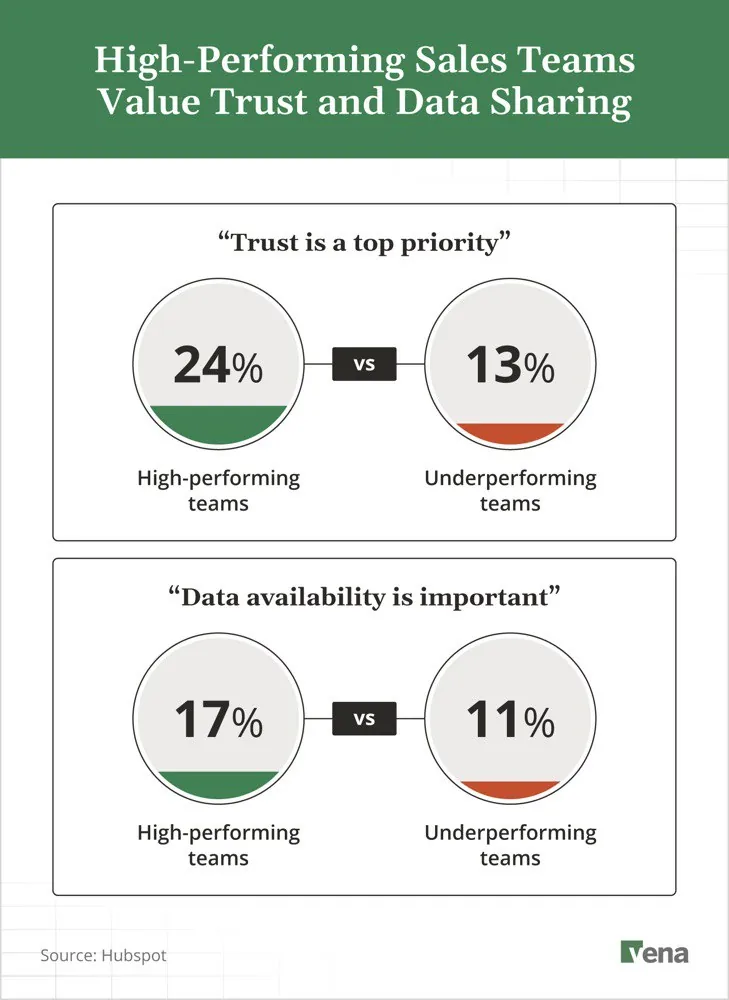
The deeper benefit of analytics is that it builds a culture of continuous improvement. By measuring and analyzing consistently, teams adjust faster. 24% of high-performing sales teams say “trust and transparency of data” is a top priority, versus only 13% of underperformers — a clear signal that openly analyzing data leads to better outcomes (7). The measure-analyze-improve-repeat loop is the heart of sales performance analytics: not a one-time project, but an ongoing practice. Teams that embrace it run more efficient pipelines and make fewer expensive mistakes.
For outbound sales, where targeting and timing are everything, the payoff is higher conversion rates, more predictable forecasts, and more closed revenue per dollar spent.
In summary, leveraging data analytics in sales turns your sales records into a goldmine of insights. It enables precision in how you manage your team and process – akin to having a diagnostic dashboard for your sales engine. Rather than flying blind or acting on hunches, your sales strategy becomes guided by evidence. For outbound sales, where efficiency and targeting are everything, this means higher conversion rates, more predictable pipelines, and ultimately, more sales.
Now, data analytics alone is powerful, but add artificial intelligence into the mix, and you truly revolutionize outbound sales. In the next section, we’ll look at how AI is turbocharging sales analysis and performance.
AI in Outbound Sales – Revolutionizing Sales Performance Analytics
87% of sales organizations now use some form of AI for tasks like prospecting, forecasting, lead scoring, or drafting emails.
Reference Source: Salesforce
It’s 2026, and AI in sales is no longer a pilot project — it’s the default operating layer. From AI-driven prospecting platforms to autonomous agents that draft and send outreach, artificial intelligence is now baked into how high-performing teams sell. Outbound sales in particular has been reshaped by AI that automates the repetitive, personalizes at scale, and surfaces patterns no analyst would catch in time to act on.
Five ways AI is changing sales performance analytics and outbound execution:
- AI adoption has crossed the tipping point. Two years ago, half of sales teams were experimenting with AI. Today, 87% of sales organizations use AI for prospecting, forecasting, lead scoring, or email drafting (2). The performance gap is real: 83% of sales teams using AI saw revenue growth in the past year, versus 66% of teams without AI. That’s a 17-point spread driven entirely by who’s letting AI do the analytical heavy lifting. 89% of AI-enabled sellers say AI deepens customer understanding, and 87% say it makes their job less stressful — both signals that the productivity story is also a retention story.
- Intelligent targeting and lead scoring. Outbound efficiency is mostly a targeting problem. Machine learning models analyze your closed-won data to find the patterns that predict a hot prospect — industry, company size, role, tech stack, recent triggers — and use those patterns to score and rank new prospects automatically. The result: reps spend their time on accounts most likely to convert instead of working a flat list. Our AI Sales Platform monitors 10M+ real-time intent signals across funding announcements, hiring surges, technology adoption, and content engagement, then surfaces the accounts most likely to be in a buying window. High-performing sales teams are roughly 1.9x more likely to use AI for tasks like predictive lead scoring than underperformers (6), a clear signal that this is no longer optional for teams trying to keep up.
- Personalization at scale. Outbound has always faced a trade-off: high personalization at low volume, or high volume with templated copy. AI has erased that trade-off. Modern language models can draft personalized email sequences in seconds, drawing on the prospect’s role, industry, recent LinkedIn activity, and company news. Tone and messaging adapt to what each segment responds to. 71% of customers expect personalization, and personalized experiences make them 80% more likely to buy (8). AI-personalized campaigns consistently outperform mail-merge blasts on reply rates — and personalized emails generate roughly 40% more revenue for top-performing companies (4). The constraint that capped outbound for a decade is gone.
- AI-enhanced coaching and performance analysis. AI isn’t just running prospecting; it’s analyzing the conversations and surfacing what’s working. Conversation intelligence platforms transcribe calls, then flag talk-track patterns that correlate with closed-won deals — where reps talk too much, where they fail to mention a differentiator, where competitor names come up. Every rep gets feedback at scale, similar to having a manager shadow every call. Sales performance analysis also benefits: AI processes mountains of CRM data and surfaces patterns no human would catch — emails sent at certain times convert better in certain industries, a particular playbook shortens cycles by weeks. 75% of sales reps say they’re more likely to hit targets with a coach or mentor (2), and AI is increasingly playing that role between human coaching sessions.
- Autonomous AI agents are scaling outreach beyond what teams could do alone. A defining 2026 trend is the rise of agentic AI — systems that don’t just suggest actions but execute them. 54% of sellers say they’ve used AI agents, and nearly 9 in 10 plan to by 2027 (2). Once fully implemented, agents are projected to cut prospect research time by 34% and email drafting by 36%. In practice, an AI sales agent might handle initial email exchanges, qualify interest, propose meeting times, and only hand off to a human rep once the lead is warmed up. The model that’s working now is hybrid: AI handles research, initial outreach, and follow-up; experienced reps focus on high-value conversations and closing. We’ve seen this combination ramp pipeline fast. In a 3-month engagement with a Chicago-based AI freight platform targeting consumer products, food and beverage, manufacturing, and retail, our AI-augmented outbound delivered 353 leads, 160 MQLs, 122 SQLs, and 108 booked meetings in just 90 days. The BD director’s words on the outcome: “Martal handily did better. We landed new logos.” View the full case study.
The bottom line: AI isn’t replacing salespeople. It’s making the strong ones significantly more effective and exposing the gap between teams that are using it and teams that aren’t. Two-thirds of sales pros have taken AI courses through work, and half are learning AI tools on their own (7), a sign that the upskilling curve is steep but the workforce is adapting. The organizations blending the art of selling with the science of AI and analytics are the ones widening their lead.
How to Analyze Sales Data: Step-by-Step Guide
Clean data improves forecasting accuracy by up to 25%
Reference Source: Forecastio
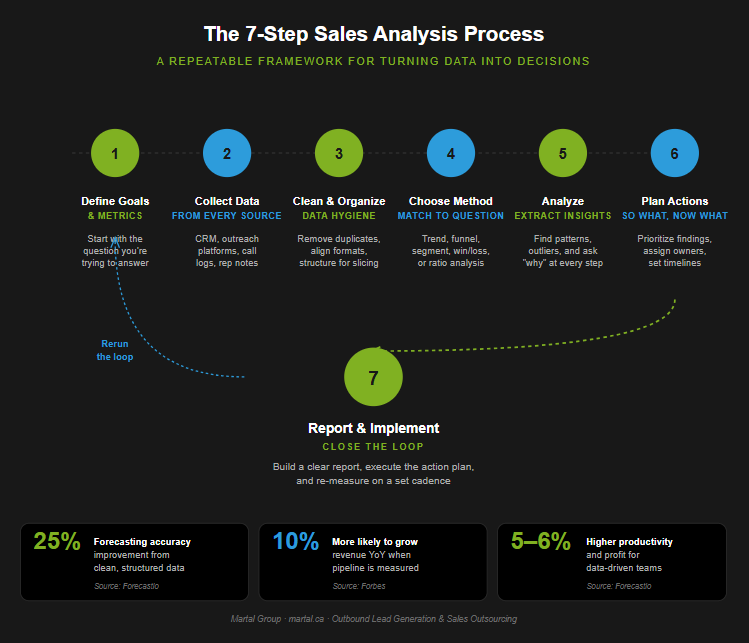
We’ve covered the why. Here’s the how. The seven-step process below is the same structure we use when reviewing pipeline performance for clients — whether it’s a quarterly deep-dive on an SDR team’s results or a year-end review of an entire outbound program. Treat it as a repeatable framework, not a one-time exercise.
Step 1: Define Your Goals & Key Metrics
Start with the question you’re trying to answer, not the data you’re trying to look at. Are you investigating a missed revenue target? Trying to lift win rates? Comparing channel performance? The clearer the question, the more useful the analysis.
From the question, derive your lead generation KPIs. For an outbound efficiency analysis, that’s typically emails sent, response rate, meetings booked, opportunities created, and deals closed from outbound leads. For an individual rep performance review, it’s quota attainment, average deal size, call volume, and conversion rates.
Pick the right number of metrics. Too few and you miss insights; too many and you drown in noise. Identify the core indicators of success and any leading signals you’ve noticed slipping (rising customer acquisition cost, lengthening sales cycle, pipeline coverage drift). Define what “success” looks like before you touch a spreadsheet.
Step 2: Collect Sales Data
Pull every relevant data source into a single dataset. Typical inputs: CRM exports (Salesforce, HubSpot, Pipedrive), marketing automation reports, sales engagement platform analytics, call logs, email engagement data, and any campaign data tied to those leads.
Gather both quantitative data (counts, amounts, dates) and qualitative data (rep notes, call transcripts, lost-deal reasons). The qualitative side is what tells you why the numbers moved, and it’s what most teams skip.
Cover every funnel stage: leads → contacts made → meetings → proposals → closed deals, with timestamps if you’re analyzing sales cycle length. Modern CRMs hold most of this in one place; if yours doesn’t, even a structured spreadsheet works for a one-time analysis.
One operational note: align your data formats before you analyze. Inconsistent date formats, mismatched rep names, or different “industry” labels across sources will sink the analysis silently. Email list cleaning and consistent data hygiene matter more than the analysis tool you pick.
Step 3: Clean and Organize the Data
Garbage in, garbage out. Before analysis, audit for errors, duplicates, and missing values. Remove duplicate deal entries, fix obvious mistakes (deals in the wrong currency, outliers that are clearly data-entry errors), and either fill or flag missing fields.
Then structure the data for slicing. Add columns like Region, Industry, Lead Source, Sales Rep, Product Category — anything you’ll want to segment by. Each row should represent a clean unit (one opportunity, one account, one logged activity). Summary tables (sales by month, by rep, by channel) make later analysis dramatically faster.
This step is unglamorous and time-consuming. It’s also where most weak sales analyses go wrong. Invest the effort here and the rest gets meaningfully easier.
Step 4: Choose a Sales Analysis Method (or Multiple)
Pick the method that fits your question. The most useful for outbound teams:
- Trend analysis — for tracking metrics over time (monthly sales, quarterly pipeline growth). Best for spotting seasonality, momentum, or drift.
- Comparative analysis — for actuals vs. targets, this period vs. last, rep vs. team average.
- Funnel/Pipeline analysis — for stage-to-stage conversion rates and finding where prospects drop off.
- Cohort or segment analysis — for breaking results by industry, company size, region, campaign, or rep.
- Win/Loss analysis — for understanding why deals were won or lost based on rep notes and closed-lost reasons.
- Ratio analysis — for efficiency metrics like win rate, lead-to-deal conversion, sales cycle length, average deal size, and benchmarking against prior periods.
Most real analyses combine methods. A typical sequence: trend analysis surfaces a revenue dip → funnel analysis shows it’s driven by fewer opportunities → segment analysis localizes it to one region → win/loss analysis explains what’s happening there. The default flow that tends to surface insights fastest: overall trend → funnel metrics → segment breakdown → individual rep performance.
Step 5: Analyze the Data and Extract Insights
This is where you crunch the numbers and ask “why” at every finding. If outbound prospecting generated 500 leads (up 10%) but lead-to-meeting conversion dropped from 20% to 15%, that’s a finding. The next question is why — staffing change, list quality issue, market shift, messaging fatigue?
Look for patterns and outliers. A product line over-performed — was it a new feature, a market trend, or one rep championing it? The sales cycle stretched 10 days — did the team start working bigger deals, or did legal review slow things? Quantify everything you can: “Rep A closed $200K, 25% above target. Rep B closed $150K, 10% below — but with a larger pipeline, indicating a lower win rate that needs coaching.”
Frame insights as problems or opportunities: “Plenty of leads, but conversion drops at the demo stage — this is a lead qualification or demo effectiveness problem.” Or: “Healthcare win rates are 2x other industries — this is an opportunity to focus more resources there.” Translate numbers into a narrative the team can act on.
This is also where structured analysis pays off in time-to-result. In a 3-month pilot with Complete EDI, an EDI solutions provider serving manufacturing, logistics, and healthcare, a single fractional rep delivered 2 SQLs in week 2 and 14 SQLs over the 3-month pilot — a result that came directly from disciplined analysis at the prospect, message, and segment level, then quickly iterating on what was working. Strong analysis doesn’t just explain the past; it accelerates what comes next.
Step 6: Draw Conclusions and Plan Actions
Insights are only as valuable as the actions they inspire. For every key finding, decide: is this a strength to capitalize on, a weakness to fix, or a hypothesis to test?
Examples of how findings translate to action:
- Winning cadence found → Standardize it across the team, then A/B test similar approaches on adjacent segments
- Bottleneck at proposal stage → Add proposal coaching, or bring in a sales engineer earlier in the cycle
- One rep underperforming on conversion → Pair with a mentor, focus coaching on the discovery-call stage where the data shows the gap
- C-level emails low engagement, calls higher → Shift SDR time toward calling C-levels directly, with email as the secondary touch
Prioritize ruthlessly. Not every insight warrants action — pick the ones that align with strategic goals and will move the needle most. Tie each action to a metric you’ll re-measure, so you can validate whether the change worked.
When presenting to leadership, frame conclusions in business terms: “By reallocating 20% of SDR effort from Channel A to Channel B, we project an additional $X in pipeline per quarter, based on conversion-rate differences observed.” That language travels well in executive meetings.
Step 7: Present and Implement Your Sales Analysis Report
Compile findings into a digestible sales analysis report for stakeholders. Tailor depth to audience: a one-pager or 3-slide summary for a team huddle; a more formal deck with visuals for an executive review.
A strong structure:
- Objectives — what the analysis set out to answer
- Findings — key data points, surfaced with charts where useful
- Conclusions — what the findings mean
- Recommendations — specific actions, with owners and timelines
Use visuals: trend charts, funnel diagrams, conversion-rate breakdowns by stage. A funnel chart showing where deals drop off does more in five seconds than two paragraphs of explanation. Where useful, anchor against external benchmarks — “Our win rate is 18%, against an industry range of roughly 20-25%, indicating room to improve at close” (3).
Make every finding actionable. For each issue, name what to do, who owns it, and when the team will re-measure. “By next month, we’ll implement updated lead scoring criteria to address lead quality. Pipeline conversion will be re-reviewed in 6 weeks.”Then execute and re-measure. A common failure mode: a great analysis gets presented, the report gets filed, nothing changes. Avoid that by making the action plan a tracked initiative with a follow-up review on the calendar.
Following these seven steps — Define goals, Collect data, Clean data, Choose methods, Analyze and extract insights, Plan actions, Report and implement — turns sales analysis from an occasional audit into a continuous improvement loop.
Once you’ve run the cycle a few times, you’ll develop a standardized template that makes future analyses faster. Consistency is what compounds: the more regularly you analyze, the earlier you spot trends and the faster you act on them.
Types of Sales Analysis & Real-World Examples
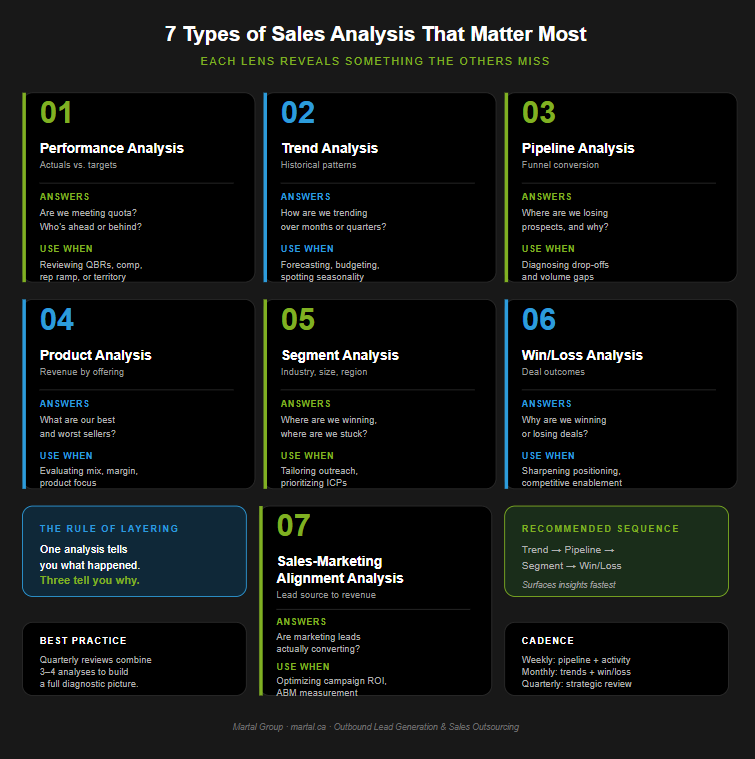
Different business questions require different analyses. The seven types below cover what most outbound teams actually need — each lens reveals something the others miss. Run two or three together and you start seeing the pattern; run them all and you have a full diagnostic.
1. Sales Performance Analysis (vs. Targets)
What it answers: Are we meeting our sales targets, and who’s exceeding or lagging?
The classic comparison: actuals against quota. If the team’s quarterly target was $1M and the result was $900K, performance analysis flags the 90%-attainment shortfall and prompts investigation. At the rep level, you might find Alice at 110% of quota while Bob hit 75% — Alice closed more deals by focusing on a new market segment, while Bob struggled with longer cycles in his territory. That’s an insight you can act on: rebalance territories, share Alice’s tactics with the team, or both.
Sales performance analysis uses metrics like conversion rate, average deal size, and quota attainment. In outbound, this often means examining whether prospecting volume is enough to feed quotas — if each SDR needs to generate 50 opportunities per quarter and only 40 are coming through, the gap is either outreach activity or top-of-funnel conversion (1).
2. Sales Trend Analysis (Historical Patterns)
What it answers: How are our sales trending over months, quarters, or years?
Trend analysis exposes seasonality, momentum, and drift. A 3-year analysis might show Q3 dips consistently — and digging in reveals that prospects are on summer vacations, lengthening sales cycles. The action: shift more lead gen to late Q2 and intensify Q4 to compensate.
Trend data is also forecasting fuel. A steady 10% quarterly growth pattern lets you project the next quarter (then adjust for known anomalies). And it surfaces drift: if outbound email response rates have declined month over month for the past six months, that’s a signal — email fatigue, email deliverability issues, or messaging that’s stopped landing.
The strength of trend analysis is its visual clarity. A line chart going up or down communicates instantly to stakeholders and is easy to act on for budgeting, hiring, and capacity planning.
3. Sales Pipeline (Funnel) Analysis
What it answers: Where in the sales process are we losing prospects, and do we have enough volume at each stage to hit targets?
This is the workhorse analysis for outbound teams. A typical quarterly funnel: 1,000 cold leads → 100 qualified opportunities (10% conversion) → 20 proposals (20%) → 10 wins (50% from proposal). If the target was 15 wins, you immediately see the gap — and the weakest link is the 10% lead-to-opportunity rate, pointing to a list quality or initial-contact problem.
After SDR retraining and refined messaging, the next quarter might shift: 1,000 leads → 150 opps (15%) → 30 proposals (20%) → 15 wins (50%). The top-of-funnel improvement was what closed the gap — an actionable result from disciplined funnel analysis.
We see this play out across long-running engagements. In a 24-month outbound program for Polygon, a Stockholm-based facilities services and IoT climate control company expanding into the US market, sustained funnel-level analysis drove 440 leads, 117 MQLs, 203 SQLs, and 139 booked meetings — and gave the client clear visibility into which conversion stages were strengthening over time. The director of marketing’s take: “Professional North American reps, simple project approach.” That’s what funnel analysis enables — a complex outbound motion that feels manageable because every stage is measured, visible, and adjustable.
Outbound sales teams rely heavily on funnel metrics like contact-to-meeting and meeting-to-close rates. Pipeline analysis by segment is also revealing: enterprise leads might convert from meeting to proposal at 50% (well-qualified), while SMB leads convert at 20% — a signal to either shift focus or improve SMB qualification.
4. Product or Service Sales Analysis
What it answers: What are our bestsellers and underperformers, and why?
Breaking sales down by product, service, or product category exposes revenue composition. If 70% of new deals are mid-tier, 20% premium, and 10% basic — and the strategy was to push premium — that’s a value-prop or pricing problem in the premium offering. On the other hand, if mid-tier carries the highest margin, the mix might be exactly what you want.
Deeper segmentation often reveals the why. Premium-tier sales might be coming almost entirely from healthcare clients who need specific compliance features — an insight that should shape marketing and outbound targeting. Basic-tier might have low sales and lowest retention, indicating it’s time to discontinue or revamp.
Product analysis also surfaces timing patterns: certain offerings sell most in Q1 because budgets reset, while others spike at year-end (1). For B2B services, this informs when to ramp outreach for a particular service line.
5. Customer Segment Analysis (by Industry, Size, Region)
What it answers: Where are we winning, and where are we struggling?
Segment analysis cuts results by industry, company size, region, or channel. If 50% of last year’s revenue came from tech, 30% from finance, 15% from healthcare, and 5% from “other” — and the strategy was to diversify into healthcare — clearly that initiative is lagging. More marketing investment, vertical-specific messaging, or product adjustments may be needed.
Sales by company size could reveal that mid-market clients have the fastest cycles and lowest acquisition cost, while enterprise deals are larger but take 6-9 months and often slip. That insight reshapes resource allocation, comp plans, and quota planning.
Segment analysis often surfaces unintentional strengths. A SaaS company analyzing their book might discover the product is unusually popular with fintech startups — a vertical they hadn’t explicitly targeted. The action: build a fintech-specific case study, tailor messaging, double down on a natural fit. Conversely, a glaring gap (“We have almost no manufacturing customers”) raises a strategic question: untapped market or poor product fit?
In outbound, segment analysis directly drives personalization. We adjust cadences and value propositions by vertical because the analysis consistently shows different industries respond to different pain points.
6. Win/Loss and Sales Effectiveness Analysis
What it answers: Why are we winning or losing deals, and how effective is our sales execution?
Categorize lost deals by reason: 40% lost to competitor X, 30% lost to “no decision,” 20% on price, 10% other. Losing nearly half to one competitor is a differentiation problem — pricing, positioning, or competitive enablement. “No decision” being high usually means prospects didn’t see enough urgency or value, signaling a value proposition or qualification gap.
The win side is just as instructive. If 70% of won deals had a sales engineer involved in the demo, that’s a practice to standardize. If deals contacted within 1 hour of lead generation closed at 2x the rate of those contacted later, speed-to-lead becomes a measurable priority.
Sales effectiveness analysis also looks at execution patterns: average touchpoints per deal, response times, calls per prospect engagement. If the data shows it takes 6+ attempts to reach prospects but the team gives up after 3, the analysis exposes a discipline gap — and the fix is straightforward: reinforce persistence as standard practice and measure it.
7. Marketing and Sales Alignment Analysis
What it answers: Are marketing leads actually converting, and which campaigns are delivering ROI?
Take all leads from a single marketing campaign — say, a whitepaper download generating 200 leads — and trace them to closed deals. If only 5 of 200 became deals, the campaign ROI was weak, and sales feedback may reveal the lead quality wasn’t right. Meanwhile, leads from a webinar might show an unusually high meeting booking rate, indicating the webinar attracted highly qualified prospects worth more marketing investment.
Marketing-sales alignment analysis often reveals correlations between marketing activity and sales outcomes — for example, “outbound response rates rose 15% during the week of our PR release.” It also exposes the misalignment that fuels most sales-marketing tension. If marketing-sourced leads close at 5% and outbound-sourced leads close at 15%, the conversation shifts from “these leads suck” to a structured discussion of lead criteria, qualification, and follow-up speed (1). For ABM programs, this analysis tracks named-account engagement and conversion specifically — for example, 30 of 50 targeted accounts engaged and 10 converted, a 20% account conversion rate that benchmarks future ABM strategy.
In practice, you’ll layer these analyses for a comprehensive review. A typical quarterly business review might include performance vs. target, pipeline conversion, product breakdown, and a win/loss summary — each revealing what the others can’t. Together they give leadership a complete picture, and they convert sales analysis from a periodic report into the operational backbone of how the team makes decisions.
Best Practices for Sales Analytics in 2026
Personalized emails generate 40% more revenue for top-performing companies.
Reference Source: McKinsey & Company
Analyzing sales data is one thing. Doing it in a way that consistently changes outcomes is another. The eight practices below are what we see separating high-performing B2B sales orgs from teams that produce dashboards no one acts on.
Make Sales Analysis a Habit
Treat sales analysis as a recurring rhythm, not a quarterly fire drill. Weekly pipeline reviews, monthly performance analyses, quarterly deep-dives — each cadence answers different questions and surfaces issues at the right altitude. Regular analysis catches drift early and normalizes data-driven decision-making across the team.
Consistency also means using consistent definitions. What qualifies as an SQL? How do you calculate conversion? Without locked definitions, period-over-period comparisons fall apart. Align analysis frequency with decision frequency: strategic pivots quarterly, tactical adjustments weekly. After any major campaign, run a quick impact analysis while the data is fresh.
The compounding effect of disciplined ongoing analysis is what most teams underestimate. In a 31-month engagement with a Canadian logistics and supply chain SaaS company targeting retailers, suppliers, manufacturers, and logistics organizations, sustained analysis at the campaign and segment level delivered 1,491 leads, 957 MQLs, 225 SQLs, and 108 booked meetings. Those numbers didn’t come from a single optimization moment. They came from 31 months of consistent analytical rhythm — review, adjust, re-measure, repeat. The co-founder’s words on the engagement: “Martal’s team technology experience was instrumental for explaining our services.”
Focus on Key Metrics
Sales data is overwhelming, and the temptation is to track everything. Resist it. Anchor every dashboard and report on the handful of KPIs that actually drive outbound success: pipeline generated, win rate, average deal size, sales cycle length, quota attainment, outreach activity volume.
Distinguish leading indicators from lagging indicators. Pipeline coverage (pipeline value vs. quota) is a critical leading indicator — if it’s healthy, minor dips in call volume aren’t alarming. If it’s thin, you boost prospecting immediately. McKinsey research shows that companies using both leading and lagging indicators to guide sales operations improve productivity by over 15% (4). Define your metric set, educate the team on what each one means, and resist the urge to add more.
Ensure Data Quality and Integrity
Your analysis is only as good as your data. Investing in CRM hygiene isn’t glamorous, but it’s foundational. Train reps to log activities and update deal stages promptly. Automate logging where possible to remove human error. Set validation rules to enforce consistent formatting on key fields like industry, employee count, and lead source.
When inaccuracies surface during analysis — a wrong close date, a deal in the wrong currency — fix them and ask why. Process tweaks usually prevent recurrence faster than data scrubs.
A single source of truth matters. When marketing and sales report different numbers for the same metric, the issue is at the data layer. Unify definitions, integrate systems into the CRM, and treat data governance as the platform every analytical decision is built on. Many teams benefit from a RevOps owner whose role is part data steward.
Sales Analysis Software: What to Use and When
The tooling category for sales analysis covers more than dashboards. In 2026, the practical question isn’t “which tool” but “which layer of the stack solves the problem you have.” Five categories cover most of what B2B teams need:
- CRM-native reporting (Salesforce, HubSpot, Pipedrive). The default starting point. Strong for pipeline visibility, rep activity, and standard funnel metrics. Limited for cross-source analysis or custom calculations.
- Business intelligence platforms (Tableau, Power BI, Looker). For multi-source analysis, custom dashboards, and visualizations the CRM can’t produce. Worth the investment when you need to combine sales, marketing, and product data.
- Sales engagement platform analytics (built into outreach platforms). Track open rates, reply rates, sequence performance, and channel-level engagement. Essential for connecting outreach activity to outcomes.
- Conversation intelligence platforms. Transcribe and analyze sales calls to surface patterns — talk-track effectiveness, objection handling, competitor mentions, deal-risk signals.
- Agentic AI sales platforms. The newer category — AI that doesn’t just report but acts. Continuously scores prospects, surfaces accounts in buying windows, and feeds analytical signals directly into outreach decisions. Martal’s AI SDR Platform is built for this category — combining 300M+ verified contacts, 10M+ real-time intent signals, and AI-driven scoring to keep outbound focused on accounts most likely to convert.
The right stack depends on team size, sales motion, and what you’re optimizing for. The wrong move is buying everything and using none of it. Start with what closes the biggest visibility gap, prove the ROI, then expand.
Combine Quantitative and Qualitative Analysis
Numbers tell you what happened. Conversations tell you why. A drop in win rate shows up in the dashboard, but the cause usually shows up in lost-deal notes — a competitor released a new feature, a common objection emerged, pricing pressure shifted. Augment quantitative analysis with rep feedback, call recording reviews, and lost-deal interviews where available.
When presenting findings, the combination is significantly more actionable. “Close rate fell 5%, and reps consistently report SMB prospects citing budget freezes” gives leadership a clear next move. “Close rate fell 5%” gives them a question.
Align Sales Analysis with Business Strategy
Keep analysis tied to what the business is actually trying to achieve. If the strategy is to move upmarket toward enterprise, your analysis should track enterprise-deal count, average deal size trend, and enterprise pipeline velocity. If profitability matters more than growth, lead with cost per lead, deals per rep, and acquisition cost trends.
Measure what matters to the business and communicate findings in business terms (revenue, market share, ROI). This secures executive support and prevents the team from optimizing for a metric that doesn’t connect to strategy. If reps start maximizing deal count at the expense of deal quality — say because of how comp is structured — the analysis should catch the trade-off early, before the lower average deal value shows up in lagging revenue.
Foster Collaboration Between Teams
Sales analysis surfaces insights that affect product, marketing, and customer success — share them. If outbound is hearing consistent product objections, loop in product management with the data. If certain marketing leads aren’t converting, work with marketing on lead criteria together rather than against each other.
Sales and marketing analysis especially benefits from joint review. If marketing-sourced leads convert at 5% and outbound-sourced leads convert at 15%, the answer isn’t blame — it’s a structured conversation about lead criteria, qualification handoffs, and follow-up speed. When teams across functions treat sales analysis as shared diagnostic feedback, the entire revenue engine improves.
Document Insights and Share Knowledge
Each round of sales analysis is an opportunity to build institutional memory. Document findings and decided actions in an accessible place — a shared doc, an internal wiki, a recurring report. New team members can review past analyses to understand what’s been tried. Looking back, you can trace which changes led to which outcomes.
Share what works. If an SDR tested a new approach and the data shows it doubled responses, broadcast it to the team. The cultural payoff matters: when wins surfaced by analysis are visible, the team starts looking for them.
The companies pulling ahead in 2026 treat sales data as a strategic asset — analyzed rigorously, acted on quickly, and shared across functions. Periodic reports don’t drive results; continuous analytical practice does.
Conclusion: Sales Analysis Is the Floor, Not the Ceiling
Sales analysis in 2026 is the operational baseline for serious outbound teams. The companies pulling ahead are using AI to surface buying intent before competitors notice it, applying segmentation discipline to focus rep effort where it converts, and treating the analyze-act-improve loop as an everyday rhythm rather than a quarterly event. The teams falling behind are still running on dashboards no one acts on and forecasts built on hope.
The themes from this guide are consistent. AI adoption has crossed the tipping point at 87% of sales organizations, and the revenue-growth gap between AI-enabled and AI-absent teams is widening. Disciplined funnel, segment, and win/loss analysis catches issues earlier and surfaces opportunities competitors miss.
Strong prospect data analysis methodology — the layered combination of firmographic, technographic, behavioral, and intent signals — is what separates a focused outbound program from a noisy one. And consistency compounds: weekly, monthly, and quarterly analytical cadences built into how the team operates produce results that sporadic deep-dives never will.
If you’re ready to operationalize this — to stop running outbound on intuition and start running it on signal — that’s where we can help. Martal’s AI SDR combines Martal’s onshore B2B sales executives with Martal’s AI Sales Platform: 300M+ verified contacts, 10M+ real-time intent signals, and AI-driven scoring that surfaces accounts most likely to convert, then orchestrates personalized omnichannel outreach across email, cold calling, and LinkedIn lead generation. Weekly performance reviews, live pipeline visibility, and continuous campaign optimization come standard — so the analytical loop you just read about runs in production, not just in theory.
Whether you’re scaling an existing outbound team with a fractional SDR model or considering outsourcing inside sales entirely, the conversation starts the same way: a free consultation where we look at your current outbound, your pipeline data, and what an AI-augmented, analytics-driven approach would look like for your business.
Book a consultation and let’s turn your sales data into the competitive advantage it should already be.
References
- Pipefy
- Salesforce — 2026 State of Sales Report
- Forecastio — Sales Performance Metrics Examples
- McKinsey & Company
- Forbes — Predicting Sales Success With AI
- Dashworks
- Vena Solutions — Sales Statistics
- The CMO — ABM Statistics
FAQs: Sales Analysis
What are the 7 steps of sales analysis?
The seven steps are: (1) Define your goals and metrics, (2) Collect sales data from every relevant source, (3) Clean and organize the data, (4) Choose your analysis method, (5) Analyze the data and extract insights, (6) Draw conclusions and plan actions, and (7) Build a sales analysis report and follow up on implementation. Each step builds on the one before it. Skipping data cleaning, in particular, is the most common reason sales analyses produce conclusions teams can’t trust — garbage in, garbage out applies even to the best dashboards. Treat this as a repeatable cycle, not a one-time project, and the analytical loop becomes the operational backbone of how the team makes decisions.
What does a sales analyst do, and what tools do they actually use?
A sales analyst collects, organizes, and interprets sales data to identify trends, track KPIs, and surface growth opportunities. The day-to-day tooling typically includes the company CRM (Salesforce, HubSpot, or Pipedrive) for pipeline data, a BI platform (Tableau, Power BI, or Looker) for cross-source visualizations, sales engagement platform analytics for outreach performance, and increasingly AI-powered scoring tools for prospect prioritization. The role’s real value isn’t the reporting — it’s the interpretation. Strong sales analysts produce reports that lead with implications and recommended actions, not just charts. They support leadership with insights that influence forecasting, territory planning, comp design, and resource allocation.
How do you measure sales performance the right way?
Sales performance is measured by combining activity metrics (calls made, emails sent, meetings set, lead response time) with outcome metrics (deals closed, revenue, win rate, average deal size, quota attainment) and comparing them against quotas, prior periods, and industry benchmarks. The most common mistake is measuring only outcomes — which tells you what happened but not how to change it. The second most common mistake is tracking too many metrics. Most teams need fewer than ten core indicators to run effectively: pipeline coverage, win rate, average deal size, sales cycle length, quota attainment, and the activity inputs that feed those outputs. Anything beyond that is supporting detail.
Which sales metrics actually matter most for outbound teams?
For outbound specifically, the highest-leverage metrics are pipeline coverage ratio (a leading indicator of whether you’ll hit future targets), lead-to-meeting conversion rate, meeting-to-opportunity conversion rate, opportunity-to-close win rate, sales cycle length, lead response time, and average deal size. Teams obsess over reply rates and open rates; those are useful but lagging diagnostic signals — they tell you about messaging quality, not pipeline health. The trap is treating activity volume as success. High call volume with low conversion isn’t a productive team; it’s a poorly targeted one. The best outbound dashboards anchor on the conversion ratios stage by stage and use activity volume as context, not as the headline metric.
How do you do win-loss analysis when you have a small team and no dedicated analyst?
Start quantitative, not qualitative. With limited time, the highest-leverage move is reviewing every closed-won and closed-lost deal in your CRM on a monthly or quarterly cadence and categorizing them by reason (lost to competitor, lost on price, no decision, lost to internal build, won on capability, won on price, won on relationship). Pull in deal size, segment, and rep involved. The patterns surface fast — if 40% of losses are to one competitor, you have a positioning problem; if “no decision” dominates, you have a value or qualification problem. Once you’ve built a quantitative baseline, layer in qualitative interviews with prospects on a sample of larger lost deals. Three deep interviews quarterly is enough to start. The point isn’t to do exhaustive research; it’s to make sure the team is acting on signals that show up consistently across deals, not just the loud anecdote from last week’s QBR.
How often should you actually be doing pipeline analysis?
The right cadence is layered. Weekly: pipeline movement, deal slippage, at-risk opportunities, lead response time. Monthly: stage conversion trends, win/loss patterns, rep performance against quota, channel-level engagement. Quarterly: pipeline structure (are stages defined correctly?), forecasting methodology, segment performance, strategic re-prioritization. Annually: full historical trends, market shifts, year-over-year segment growth, comp plan effectiveness. The mistake most teams make is collapsing all of this into a single quarterly review — by which point the actionable window for half the insights has already closed. The teams pulling ahead are the ones running the weekly rhythm in production, not just the quarterly slide deck.